Spanish vs Italian Child Poverty Among Boys Under 16
COMPARE
Spanish
Italian
Child Poverty Among Boys Under 16
Child Poverty Among Boys Under 16 Comparison
Spanish
Italians
17.0%
CHILD POVERTY AMONG BOYS UNDER 16
20.8/ 100
METRIC RATING
195th/ 347
METRIC RANK
14.2%
CHILD POVERTY AMONG BOYS UNDER 16
99.2/ 100
METRIC RATING
50th/ 347
METRIC RANK
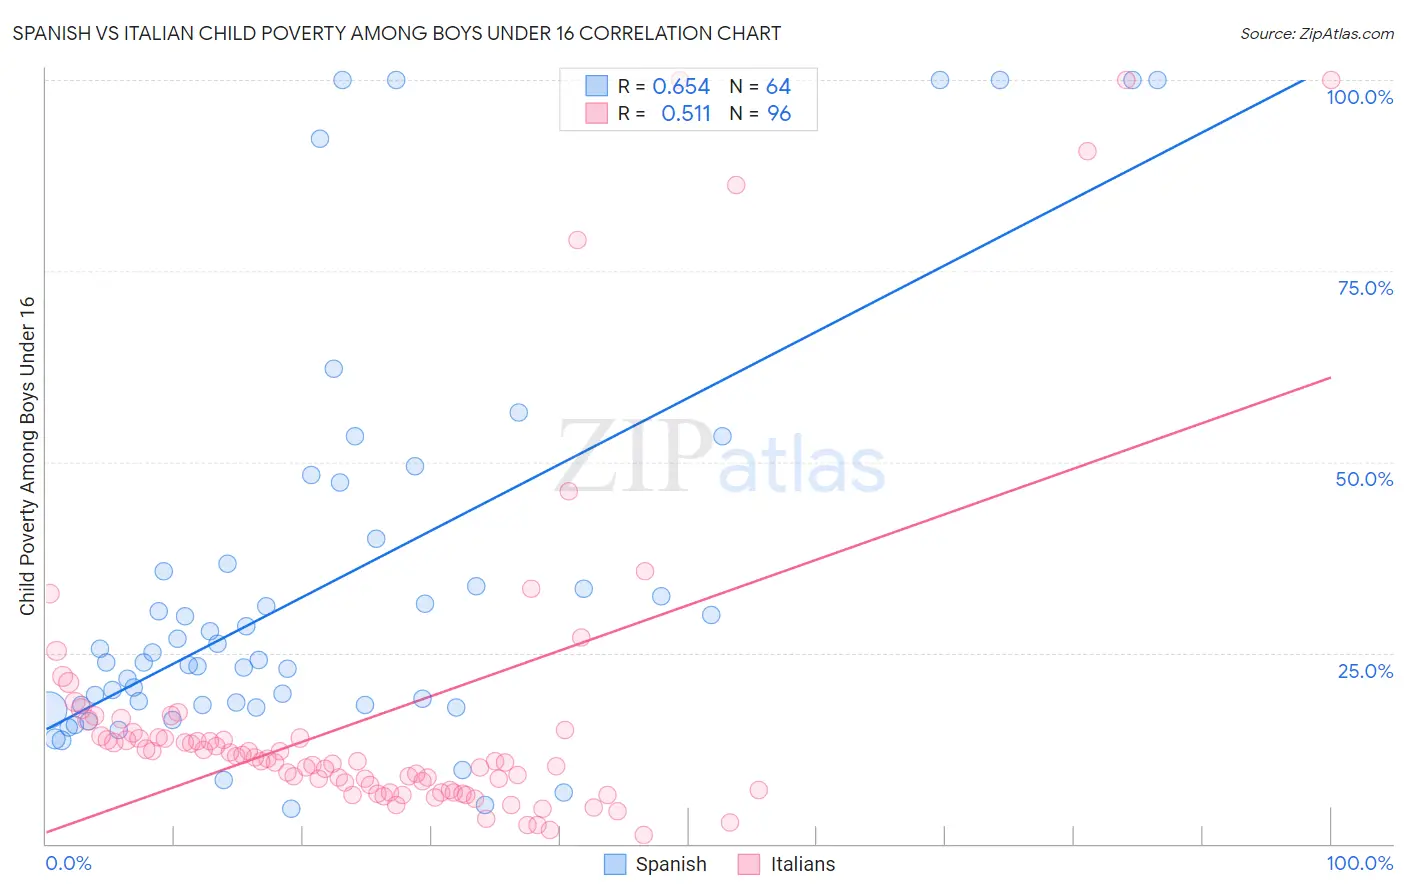
Spanish vs Italian Child Poverty Among Boys Under 16 Correlation Chart
The statistical analysis conducted on geographies consisting of 415,463,522 people shows a significant positive correlation between the proportion of Spanish and poverty level among boys under the age of 16 in the United States with a correlation coefficient (R) of 0.654 and weighted average of 17.0%. Similarly, the statistical analysis conducted on geographies consisting of 553,398,049 people shows a substantial positive correlation between the proportion of Italians and poverty level among boys under the age of 16 in the United States with a correlation coefficient (R) of 0.511 and weighted average of 14.2%, a difference of 20.0%.
Child Poverty Among Boys Under 16 Correlation Summary
| Measurement | Spanish | Italian |
| Minimum | 4.6% | 1.1% |
| Maximum | 100.0% | 100.0% |
| Range | 95.4% | 98.9% |
| Mean | 33.7% | 16.8% |
| Median | 23.9% | 10.8% |
| Interquartile 25% (IQ1) | 18.2% | 7.1% |
| Interquartile 75% (IQ3) | 36.2% | 14.0% |
| Interquartile Range (IQR) | 18.0% | 6.9% |
| Standard Deviation (Sample) | 26.1% | 21.1% |
| Standard Deviation (Population) | 25.9% | 20.9% |
Similar Demographics by Child Poverty Among Boys Under 16
Demographics Similar to Spanish by Child Poverty Among Boys Under 16
In terms of child poverty among boys under 16, the demographic groups most similar to Spanish are Spaniard (17.1%, a difference of 0.040%), Immigrants from Lebanon (17.0%, a difference of 0.070%), Immigrants from Kenya (17.1%, a difference of 0.11%), Immigrants from Uganda (17.0%, a difference of 0.14%), and Immigrants from Iraq (17.0%, a difference of 0.14%).
| Demographics | Rating | Rank | Child Poverty Among Boys Under 16 |
| Immigrants | South America | 37.7 /100 | #188 | Fair 16.7% |
| Immigrants | Morocco | 34.5 /100 | #189 | Fair 16.7% |
| Arabs | 31.1 /100 | #190 | Fair 16.8% |
| Alaska Natives | 29.8 /100 | #191 | Fair 16.8% |
| Immigrants | Uganda | 21.6 /100 | #192 | Fair 17.0% |
| Immigrants | Iraq | 21.6 /100 | #193 | Fair 17.0% |
| Immigrants | Lebanon | 21.2 /100 | #194 | Fair 17.0% |
| Spanish | 20.8 /100 | #195 | Fair 17.0% |
| Spaniards | 20.5 /100 | #196 | Fair 17.1% |
| Immigrants | Kenya | 20.1 /100 | #197 | Fair 17.1% |
| Immigrants | Cameroon | 19.0 /100 | #198 | Poor 17.1% |
| Delaware | 18.8 /100 | #199 | Poor 17.1% |
| Immigrants | Uruguay | 16.9 /100 | #200 | Poor 17.2% |
| Immigrants | Afghanistan | 13.7 /100 | #201 | Poor 17.3% |
| Immigrants | Sierra Leone | 13.4 /100 | #202 | Poor 17.3% |
Demographics Similar to Italians by Child Poverty Among Boys Under 16
In terms of child poverty among boys under 16, the demographic groups most similar to Italians are Immigrants from Greece (14.2%, a difference of 0.13%), Czech (14.1%, a difference of 0.49%), Immigrants from Indonesia (14.1%, a difference of 0.57%), Immigrants from Moldova (14.1%, a difference of 0.59%), and Laotian (14.3%, a difference of 0.82%).
| Demographics | Rating | Rank | Child Poverty Among Boys Under 16 |
| Croatians | 99.5 /100 | #43 | Exceptional 14.0% |
| Estonians | 99.4 /100 | #44 | Exceptional 14.1% |
| Immigrants | Scotland | 99.4 /100 | #45 | Exceptional 14.1% |
| Greeks | 99.4 /100 | #46 | Exceptional 14.1% |
| Immigrants | Moldova | 99.4 /100 | #47 | Exceptional 14.1% |
| Immigrants | Indonesia | 99.4 /100 | #48 | Exceptional 14.1% |
| Czechs | 99.3 /100 | #49 | Exceptional 14.1% |
| Italians | 99.2 /100 | #50 | Exceptional 14.2% |
| Immigrants | Greece | 99.2 /100 | #51 | Exceptional 14.2% |
| Laotians | 99.0 /100 | #52 | Exceptional 14.3% |
| Immigrants | Philippines | 99.0 /100 | #53 | Exceptional 14.3% |
| Immigrants | Serbia | 99.0 /100 | #54 | Exceptional 14.3% |
| Immigrants | Pakistan | 99.0 /100 | #55 | Exceptional 14.3% |
| Zimbabweans | 99.0 /100 | #56 | Exceptional 14.3% |
| Poles | 98.9 /100 | #57 | Exceptional 14.4% |