British West Indian vs Crow Family Poverty
COMPARE
British West Indian
Crow
Family Poverty
Family Poverty Comparison
British West Indians
Crow
12.4%
FAMILY POVERTY
0.0/ 100
METRIC RATING
319th/ 347
METRIC RANK
16.1%
FAMILY POVERTY
0.0/ 100
METRIC RATING
338th/ 347
METRIC RANK
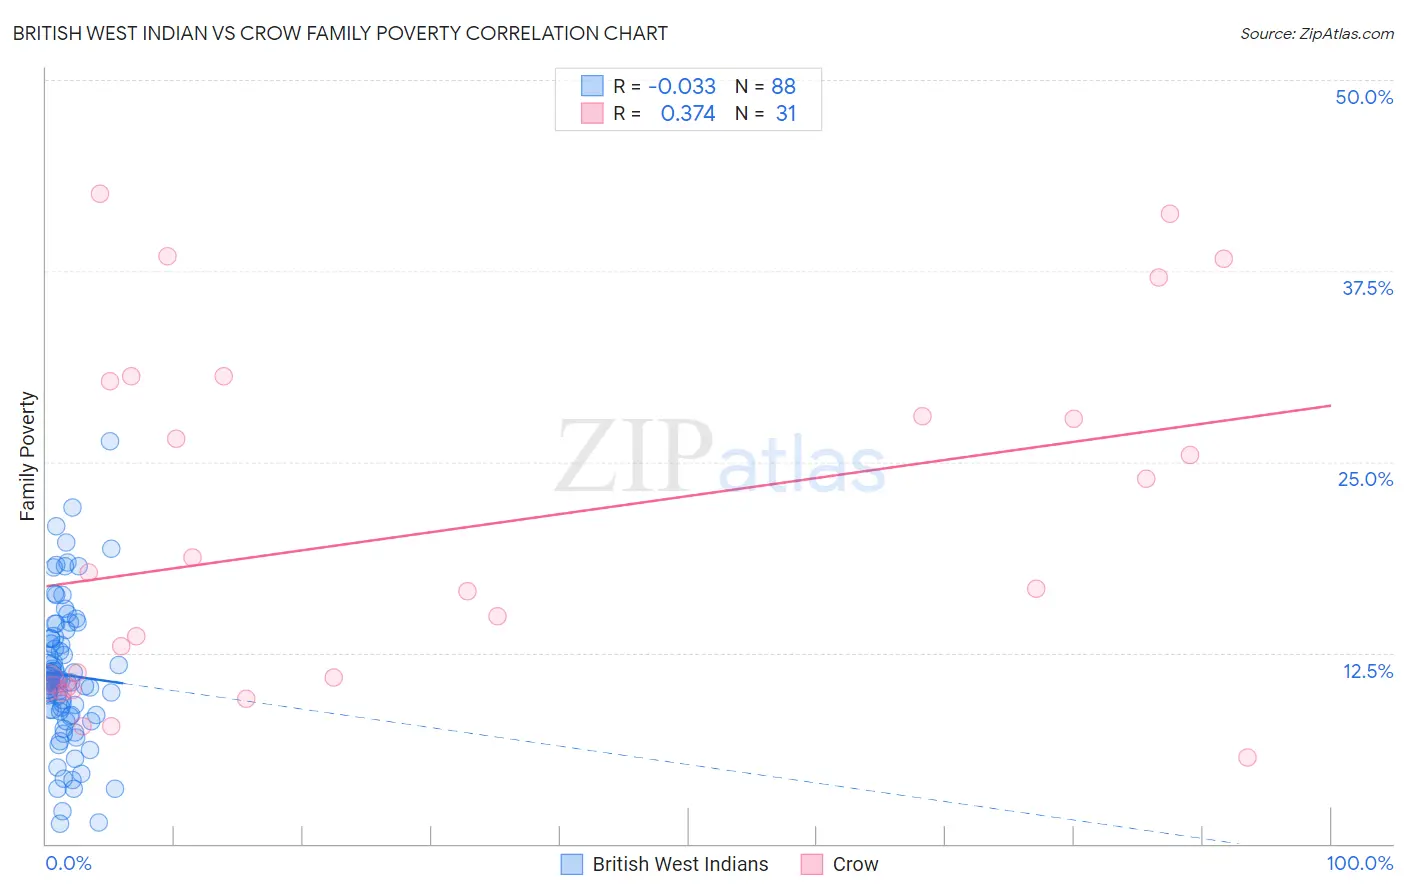
British West Indian vs Crow Family Poverty Correlation Chart
The statistical analysis conducted on geographies consisting of 152,513,896 people shows no correlation between the proportion of British West Indians and poverty level among families in the United States with a correlation coefficient (R) of -0.033 and weighted average of 12.4%. Similarly, the statistical analysis conducted on geographies consisting of 59,176,312 people shows a mild positive correlation between the proportion of Crow and poverty level among families in the United States with a correlation coefficient (R) of 0.374 and weighted average of 16.1%, a difference of 29.9%.
Family Poverty Correlation Summary
| Measurement | British West Indian | Crow |
| Minimum | 1.3% | 5.7% |
| Maximum | 26.4% | 42.6% |
| Range | 25.0% | 36.9% |
| Mean | 11.0% | 20.5% |
| Median | 10.6% | 16.7% |
| Interquartile 25% (IQ1) | 8.4% | 10.4% |
| Interquartile 75% (IQ3) | 13.5% | 30.3% |
| Interquartile Range (IQR) | 5.1% | 19.9% |
| Standard Deviation (Sample) | 4.7% | 11.4% |
| Standard Deviation (Population) | 4.7% | 11.2% |
Demographics Similar to British West Indians and Crow by Family Poverty
In terms of family poverty, the demographic groups most similar to British West Indians are U.S. Virgin Islander (12.4%, a difference of 0.050%), Inupiat (12.5%, a difference of 0.48%), Arapaho (12.7%, a difference of 2.0%), Immigrants from Honduras (12.7%, a difference of 2.1%), and Menominee (12.7%, a difference of 2.7%). Similarly, the demographic groups most similar to Crow are Hopi (15.9%, a difference of 1.1%), Sioux (15.9%, a difference of 1.6%), Apache (14.7%, a difference of 9.3%), Houma (14.6%, a difference of 10.2%), and Immigrants from Dominican Republic (14.4%, a difference of 11.6%).
| Demographics | Rating | Rank | Family Poverty |
| U.S. Virgin Islanders | 0.0 /100 | #318 | Tragic 12.4% |
| British West Indians | 0.0 /100 | #319 | Tragic 12.4% |
| Inupiat | 0.0 /100 | #320 | Tragic 12.5% |
| Arapaho | 0.0 /100 | #321 | Tragic 12.7% |
| Immigrants | Honduras | 0.0 /100 | #322 | Tragic 12.7% |
| Menominee | 0.0 /100 | #323 | Tragic 12.7% |
| Immigrants | Dominica | 0.0 /100 | #324 | Tragic 12.7% |
| Paiute | 0.0 /100 | #325 | Tragic 13.0% |
| Colville | 0.0 /100 | #326 | Tragic 13.0% |
| Yakama | 0.0 /100 | #327 | Tragic 13.1% |
| Central American Indians | 0.0 /100 | #328 | Tragic 13.3% |
| Blacks/African Americans | 0.0 /100 | #329 | Tragic 13.3% |
| Natives/Alaskans | 0.0 /100 | #330 | Tragic 14.3% |
| Cheyenne | 0.0 /100 | #331 | Tragic 14.3% |
| Dominicans | 0.0 /100 | #332 | Tragic 14.3% |
| Immigrants | Dominican Republic | 0.0 /100 | #333 | Tragic 14.4% |
| Houma | 0.0 /100 | #334 | Tragic 14.6% |
| Apache | 0.0 /100 | #335 | Tragic 14.7% |
| Sioux | 0.0 /100 | #336 | Tragic 15.9% |
| Hopi | 0.0 /100 | #337 | Tragic 15.9% |
| Crow | 0.0 /100 | #338 | Tragic 16.1% |