Osage vs Turkish Poverty
COMPARE
Osage
Turkish
Poverty
Poverty Comparison
Osage
Turks
13.6%
POVERTY
1.5/ 100
METRIC RATING
229th/ 347
METRIC RANK
11.0%
POVERTY
98.9/ 100
METRIC RATING
45th/ 347
METRIC RANK
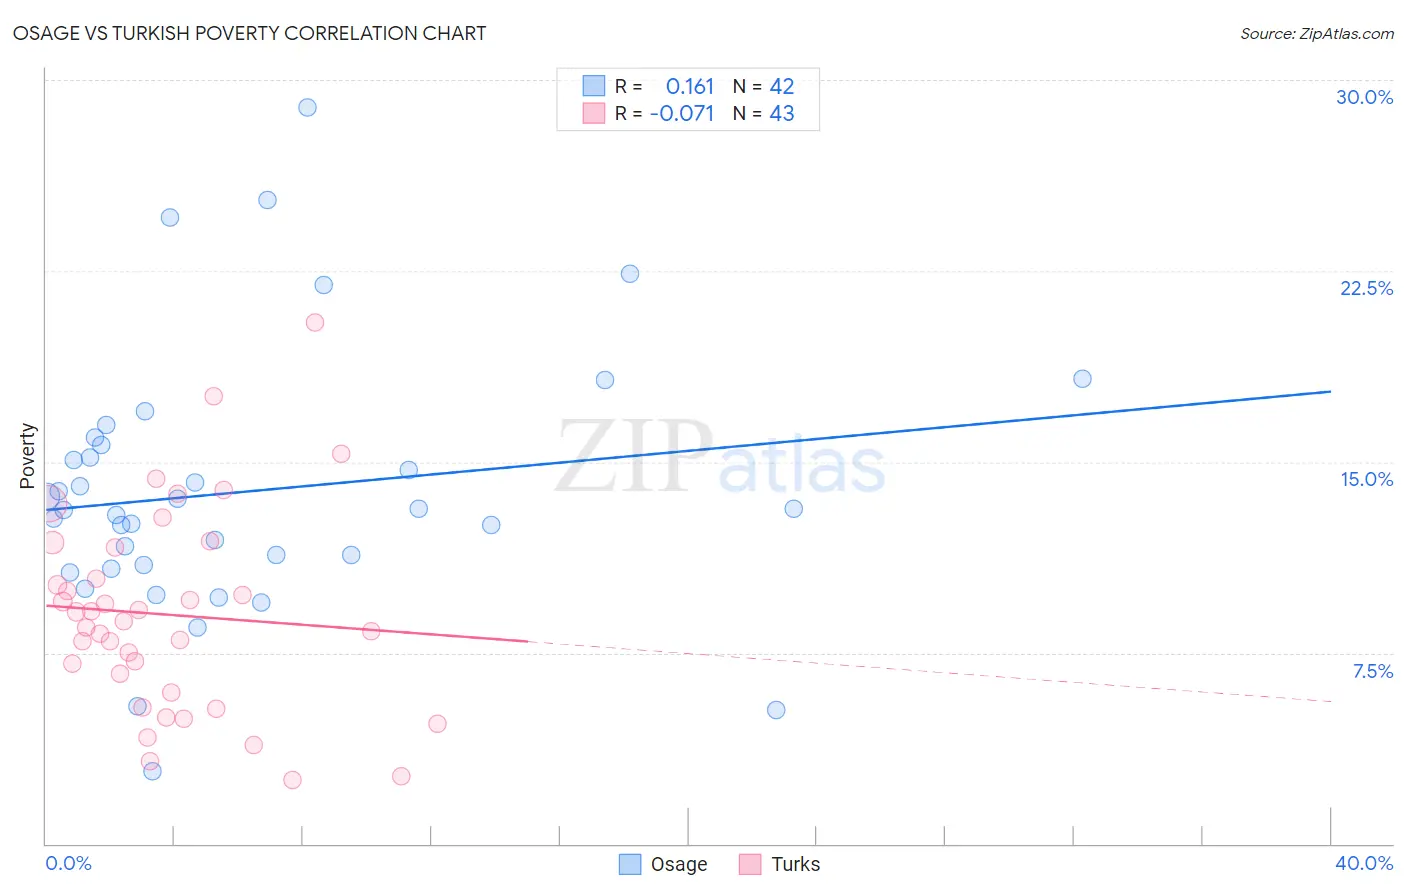
Osage vs Turkish Poverty Correlation Chart
The statistical analysis conducted on geographies consisting of 91,797,306 people shows a poor positive correlation between the proportion of Osage and poverty level in the United States with a correlation coefficient (R) of 0.161 and weighted average of 13.6%. Similarly, the statistical analysis conducted on geographies consisting of 271,706,785 people shows a slight negative correlation between the proportion of Turks and poverty level in the United States with a correlation coefficient (R) of -0.071 and weighted average of 11.0%, a difference of 23.7%.
Poverty Correlation Summary
| Measurement | Osage | Turkish |
| Minimum | 2.8% | 2.5% |
| Maximum | 28.9% | 20.5% |
| Range | 26.1% | 18.0% |
| Mean | 13.8% | 9.0% |
| Median | 13.1% | 8.7% |
| Interquartile 25% (IQ1) | 10.9% | 6.0% |
| Interquartile 75% (IQ3) | 15.7% | 11.6% |
| Interquartile Range (IQR) | 4.7% | 5.7% |
| Standard Deviation (Sample) | 5.2% | 3.9% |
| Standard Deviation (Population) | 5.1% | 3.9% |
Similar Demographics by Poverty
Demographics Similar to Osage by Poverty
In terms of poverty, the demographic groups most similar to Osage are Alaskan Athabascan (13.6%, a difference of 0.060%), Nigerian (13.6%, a difference of 0.22%), Immigrants from Nigeria (13.5%, a difference of 0.24%), Alaska Native (13.5%, a difference of 0.69%), and Marshallese (13.4%, a difference of 0.85%).
| Demographics | Rating | Rank | Poverty |
| Immigrants | Micronesia | 2.6 /100 | #222 | Tragic 13.4% |
| Immigrants | Africa | 2.5 /100 | #223 | Tragic 13.4% |
| Immigrants | Eritrea | 2.4 /100 | #224 | Tragic 13.4% |
| German Russians | 2.2 /100 | #225 | Tragic 13.4% |
| Marshallese | 2.2 /100 | #226 | Tragic 13.4% |
| Alaska Natives | 2.1 /100 | #227 | Tragic 13.5% |
| Immigrants | Nigeria | 1.7 /100 | #228 | Tragic 13.5% |
| Osage | 1.5 /100 | #229 | Tragic 13.6% |
| Alaskan Athabascans | 1.5 /100 | #230 | Tragic 13.6% |
| Nigerians | 1.4 /100 | #231 | Tragic 13.6% |
| Fijians | 0.8 /100 | #232 | Tragic 13.7% |
| Immigrants | Saudi Arabia | 0.8 /100 | #233 | Tragic 13.8% |
| Immigrants | Laos | 0.7 /100 | #234 | Tragic 13.8% |
| Cubans | 0.6 /100 | #235 | Tragic 13.9% |
| Immigrants | Armenia | 0.5 /100 | #236 | Tragic 13.9% |
Demographics Similar to Turks by Poverty
In terms of poverty, the demographic groups most similar to Turks are Immigrants from Czechoslovakia (11.0%, a difference of 0.080%), Immigrants from Romania (11.0%, a difference of 0.10%), Slovene (11.0%, a difference of 0.14%), Immigrants from Japan (11.0%, a difference of 0.15%), and Asian (11.0%, a difference of 0.18%).
| Demographics | Rating | Rank | Poverty |
| Czechs | 99.3 /100 | #38 | Exceptional 10.8% |
| Immigrants | Pakistan | 99.3 /100 | #39 | Exceptional 10.8% |
| Russians | 99.3 /100 | #40 | Exceptional 10.9% |
| Immigrants | Iran | 99.2 /100 | #41 | Exceptional 10.9% |
| Koreans | 99.2 /100 | #42 | Exceptional 10.9% |
| Immigrants | Singapore | 99.2 /100 | #43 | Exceptional 10.9% |
| Immigrants | Moldova | 99.1 /100 | #44 | Exceptional 10.9% |
| Turks | 98.9 /100 | #45 | Exceptional 11.0% |
| Immigrants | Czechoslovakia | 98.9 /100 | #46 | Exceptional 11.0% |
| Immigrants | Romania | 98.9 /100 | #47 | Exceptional 11.0% |
| Slovenes | 98.9 /100 | #48 | Exceptional 11.0% |
| Immigrants | Japan | 98.9 /100 | #49 | Exceptional 11.0% |
| Asians | 98.9 /100 | #50 | Exceptional 11.0% |
| Immigrants | Croatia | 98.7 /100 | #51 | Exceptional 11.0% |
| Immigrants | Philippines | 98.7 /100 | #52 | Exceptional 11.0% |