Immigrants from Australia vs Turkish Poverty
COMPARE
Immigrants from Australia
Turkish
Poverty
Poverty Comparison
Immigrants from Australia
Turks
11.2%
POVERTY
97.4/ 100
METRIC RATING
67th/ 347
METRIC RANK
11.0%
POVERTY
98.9/ 100
METRIC RATING
45th/ 347
METRIC RANK
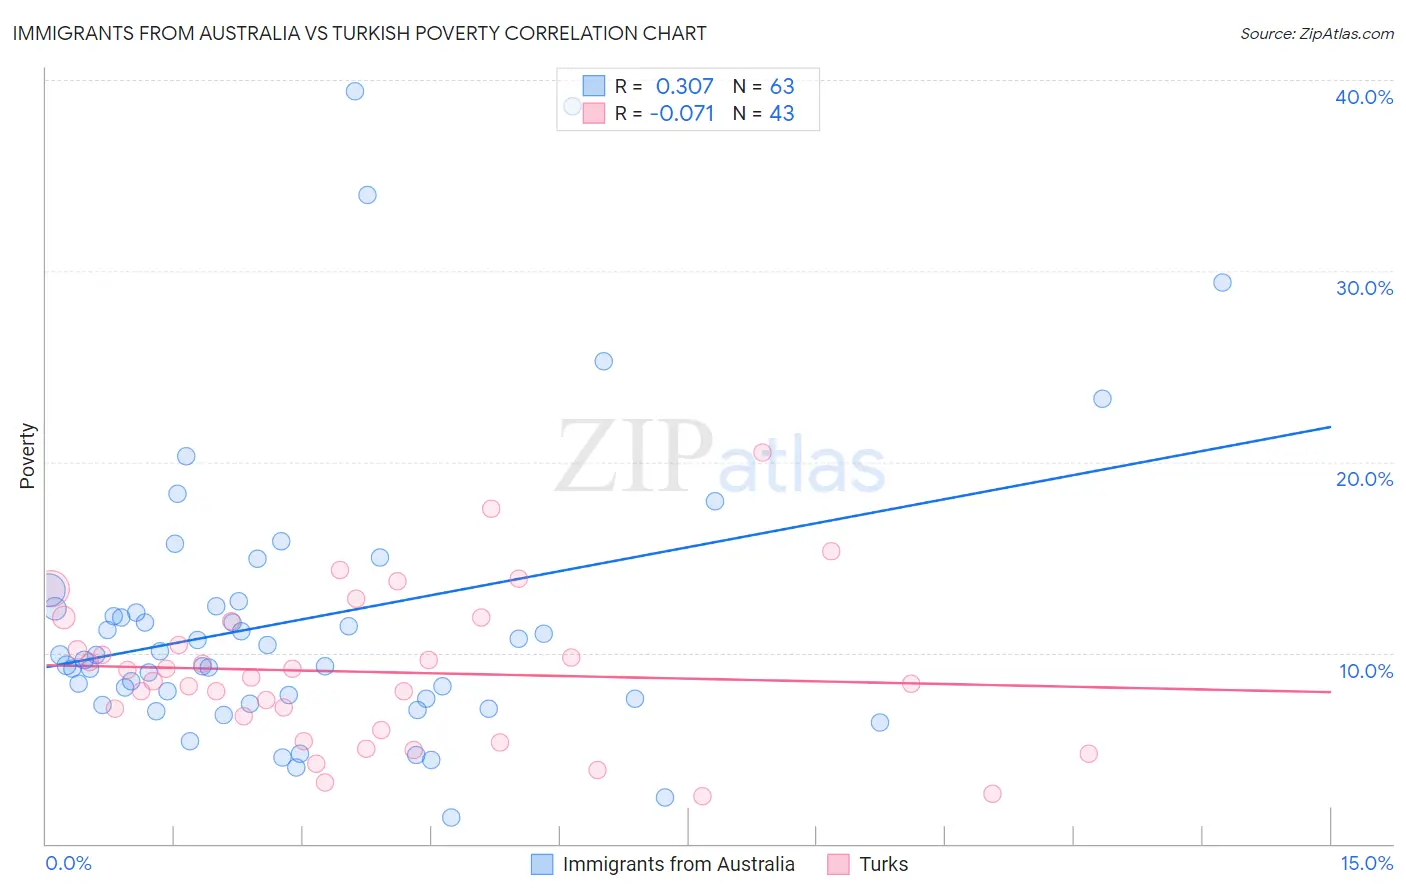
Immigrants from Australia vs Turkish Poverty Correlation Chart
The statistical analysis conducted on geographies consisting of 227,147,878 people shows a mild positive correlation between the proportion of Immigrants from Australia and poverty level in the United States with a correlation coefficient (R) of 0.307 and weighted average of 11.2%. Similarly, the statistical analysis conducted on geographies consisting of 271,706,785 people shows a slight negative correlation between the proportion of Turks and poverty level in the United States with a correlation coefficient (R) of -0.071 and weighted average of 11.0%, a difference of 2.5%.
Poverty Correlation Summary
| Measurement | Immigrants from Australia | Turkish |
| Minimum | 1.4% | 2.5% |
| Maximum | 39.4% | 20.5% |
| Range | 38.1% | 18.0% |
| Mean | 11.8% | 9.0% |
| Median | 9.9% | 8.7% |
| Interquartile 25% (IQ1) | 7.6% | 6.0% |
| Interquartile 75% (IQ3) | 12.5% | 11.6% |
| Interquartile Range (IQR) | 4.9% | 5.7% |
| Standard Deviation (Sample) | 7.7% | 3.9% |
| Standard Deviation (Population) | 7.6% | 3.9% |
Similar Demographics by Poverty
Demographics Similar to Immigrants from Australia by Poverty
In terms of poverty, the demographic groups most similar to Immigrants from Australia are Slovak (11.2%, a difference of 0.020%), Immigrants from Netherlands (11.2%, a difference of 0.040%), Serbian (11.2%, a difference of 0.080%), Immigrants from Asia (11.2%, a difference of 0.11%), and Immigrants from Canada (11.3%, a difference of 0.17%).
| Demographics | Rating | Rank | Poverty |
| Immigrants | Sri Lanka | 97.9 /100 | #60 | Exceptional 11.2% |
| Immigrants | Italy | 97.9 /100 | #61 | Exceptional 11.2% |
| Austrians | 97.8 /100 | #62 | Exceptional 11.2% |
| Ukrainians | 97.8 /100 | #63 | Exceptional 11.2% |
| Swiss | 97.7 /100 | #64 | Exceptional 11.2% |
| Immigrants | Asia | 97.5 /100 | #65 | Exceptional 11.2% |
| Immigrants | Netherlands | 97.5 /100 | #66 | Exceptional 11.2% |
| Immigrants | Australia | 97.4 /100 | #67 | Exceptional 11.2% |
| Slovaks | 97.4 /100 | #68 | Exceptional 11.2% |
| Serbians | 97.4 /100 | #69 | Exceptional 11.2% |
| Immigrants | Canada | 97.3 /100 | #70 | Exceptional 11.3% |
| Zimbabweans | 97.3 /100 | #71 | Exceptional 11.3% |
| Europeans | 97.2 /100 | #72 | Exceptional 11.3% |
| Immigrants | Belgium | 97.2 /100 | #73 | Exceptional 11.3% |
| Carpatho Rusyns | 97.2 /100 | #74 | Exceptional 11.3% |
Demographics Similar to Turks by Poverty
In terms of poverty, the demographic groups most similar to Turks are Immigrants from Czechoslovakia (11.0%, a difference of 0.080%), Immigrants from Romania (11.0%, a difference of 0.10%), Slovene (11.0%, a difference of 0.14%), Immigrants from Japan (11.0%, a difference of 0.15%), and Asian (11.0%, a difference of 0.18%).
| Demographics | Rating | Rank | Poverty |
| Czechs | 99.3 /100 | #38 | Exceptional 10.8% |
| Immigrants | Pakistan | 99.3 /100 | #39 | Exceptional 10.8% |
| Russians | 99.3 /100 | #40 | Exceptional 10.9% |
| Immigrants | Iran | 99.2 /100 | #41 | Exceptional 10.9% |
| Koreans | 99.2 /100 | #42 | Exceptional 10.9% |
| Immigrants | Singapore | 99.2 /100 | #43 | Exceptional 10.9% |
| Immigrants | Moldova | 99.1 /100 | #44 | Exceptional 10.9% |
| Turks | 98.9 /100 | #45 | Exceptional 11.0% |
| Immigrants | Czechoslovakia | 98.9 /100 | #46 | Exceptional 11.0% |
| Immigrants | Romania | 98.9 /100 | #47 | Exceptional 11.0% |
| Slovenes | 98.9 /100 | #48 | Exceptional 11.0% |
| Immigrants | Japan | 98.9 /100 | #49 | Exceptional 11.0% |
| Asians | 98.9 /100 | #50 | Exceptional 11.0% |
| Immigrants | Croatia | 98.7 /100 | #51 | Exceptional 11.0% |
| Immigrants | Philippines | 98.7 /100 | #52 | Exceptional 11.0% |