Osage vs Immigrants from Indonesia Seniors Poverty Over the Age of 65
COMPARE
Osage
Immigrants from Indonesia
Seniors Poverty Over the Age of 65
Seniors Poverty Over the Age of 65 Comparison
Osage
Immigrants from Indonesia
10.6%
SENIORS POVERTY OVER THE AGE OF 65
82.8/ 100
METRIC RATING
142nd/ 347
METRIC RANK
10.8%
SENIORS POVERTY OVER THE AGE OF 65
64.8/ 100
METRIC RATING
162nd/ 347
METRIC RANK
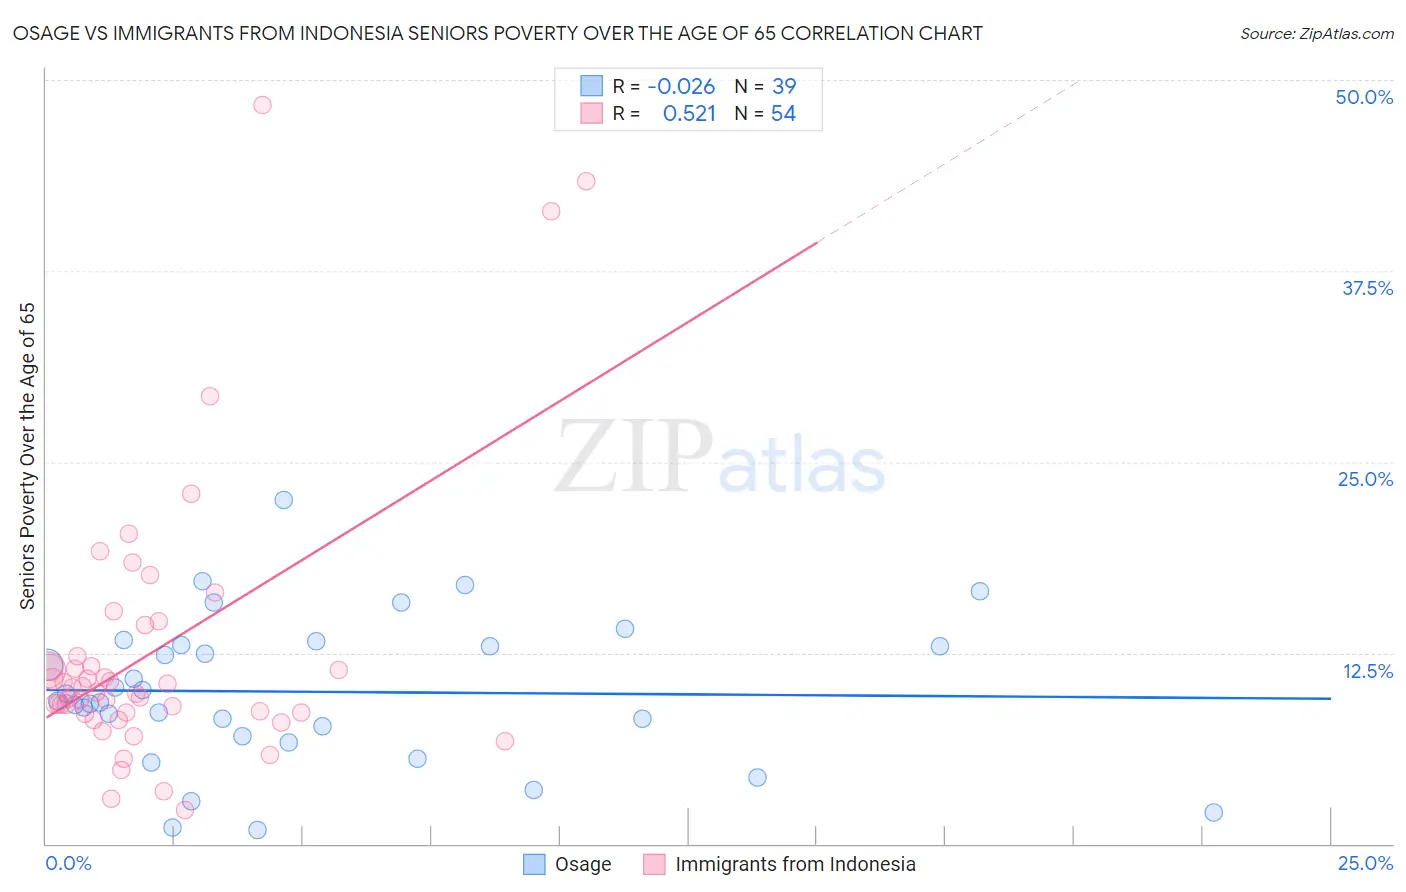
Osage vs Immigrants from Indonesia Seniors Poverty Over the Age of 65 Correlation Chart
The statistical analysis conducted on geographies consisting of 91,738,708 people shows no correlation between the proportion of Osage and poverty level among seniors over the age of 65 in the United States with a correlation coefficient (R) of -0.026 and weighted average of 10.6%. Similarly, the statistical analysis conducted on geographies consisting of 215,406,593 people shows a substantial positive correlation between the proportion of Immigrants from Indonesia and poverty level among seniors over the age of 65 in the United States with a correlation coefficient (R) of 0.521 and weighted average of 10.8%, a difference of 2.2%.
Seniors Poverty Over the Age of 65 Correlation Summary
| Measurement | Osage | Immigrants from Indonesia |
| Minimum | 0.89% | 2.2% |
| Maximum | 22.5% | 48.3% |
| Range | 21.6% | 46.1% |
| Mean | 9.9% | 12.7% |
| Median | 9.3% | 10.1% |
| Interquartile 25% (IQ1) | 7.1% | 8.6% |
| Interquartile 75% (IQ3) | 13.0% | 12.3% |
| Interquartile Range (IQR) | 5.9% | 3.7% |
| Standard Deviation (Sample) | 4.8% | 9.2% |
| Standard Deviation (Population) | 4.7% | 9.1% |
Demographics Similar to Osage and Immigrants from Indonesia by Seniors Poverty Over the Age of 65
In terms of seniors poverty over the age of 65, the demographic groups most similar to Osage are Immigrants from Asia (10.6%, a difference of 0.32%), Iraqi (10.6%, a difference of 0.33%), Laotian (10.6%, a difference of 0.45%), Alaskan Athabascan (10.6%, a difference of 0.55%), and Immigrants from Greece (10.6%, a difference of 0.57%). Similarly, the demographic groups most similar to Immigrants from Indonesia are Arab (10.8%, a difference of 0.040%), Sudanese (10.7%, a difference of 0.35%), Immigrants from Micronesia (10.7%, a difference of 0.62%), Immigrants from Sierra Leone (10.7%, a difference of 0.71%), and Immigrants from Ethiopia (10.7%, a difference of 0.85%).
| Demographics | Rating | Rank | Seniors Poverty Over the Age of 65 |
| Osage | 82.8 /100 | #142 | Excellent 10.6% |
| Immigrants | Asia | 80.8 /100 | #143 | Excellent 10.6% |
| Iraqis | 80.7 /100 | #144 | Excellent 10.6% |
| Laotians | 79.9 /100 | #145 | Good 10.6% |
| Alaskan Athabascans | 79.1 /100 | #146 | Good 10.6% |
| Immigrants | Greece | 79.0 /100 | #147 | Good 10.6% |
| Americans | 78.1 /100 | #148 | Good 10.6% |
| Immigrants | Cameroon | 78.1 /100 | #149 | Good 10.6% |
| Immigrants | Switzerland | 77.3 /100 | #150 | Good 10.6% |
| Spanish | 76.8 /100 | #151 | Good 10.6% |
| Immigrants | Egypt | 76.5 /100 | #152 | Good 10.6% |
| Fijians | 75.6 /100 | #153 | Good 10.7% |
| Immigrants | Saudi Arabia | 74.9 /100 | #154 | Good 10.7% |
| Chickasaw | 73.6 /100 | #155 | Good 10.7% |
| Ethiopians | 72.9 /100 | #156 | Good 10.7% |
| Immigrants | Ethiopia | 72.9 /100 | #157 | Good 10.7% |
| Immigrants | Sierra Leone | 71.7 /100 | #158 | Good 10.7% |
| Immigrants | Micronesia | 70.8 /100 | #159 | Good 10.7% |
| Sudanese | 68.2 /100 | #160 | Good 10.7% |
| Arabs | 65.2 /100 | #161 | Good 10.8% |
| Immigrants | Indonesia | 64.8 /100 | #162 | Good 10.8% |