Osage vs Immigrants from Indonesia College, Under 1 year
COMPARE
Osage
Immigrants from Indonesia
College, Under 1 year
College, Under 1 year Comparison
Osage
Immigrants from Indonesia
62.7%
COLLEGE, UNDER 1 YEAR
2.2/ 100
METRIC RATING
232nd/ 347
METRIC RANK
68.9%
COLLEGE, UNDER 1 YEAR
99.2/ 100
METRIC RATING
68th/ 347
METRIC RANK
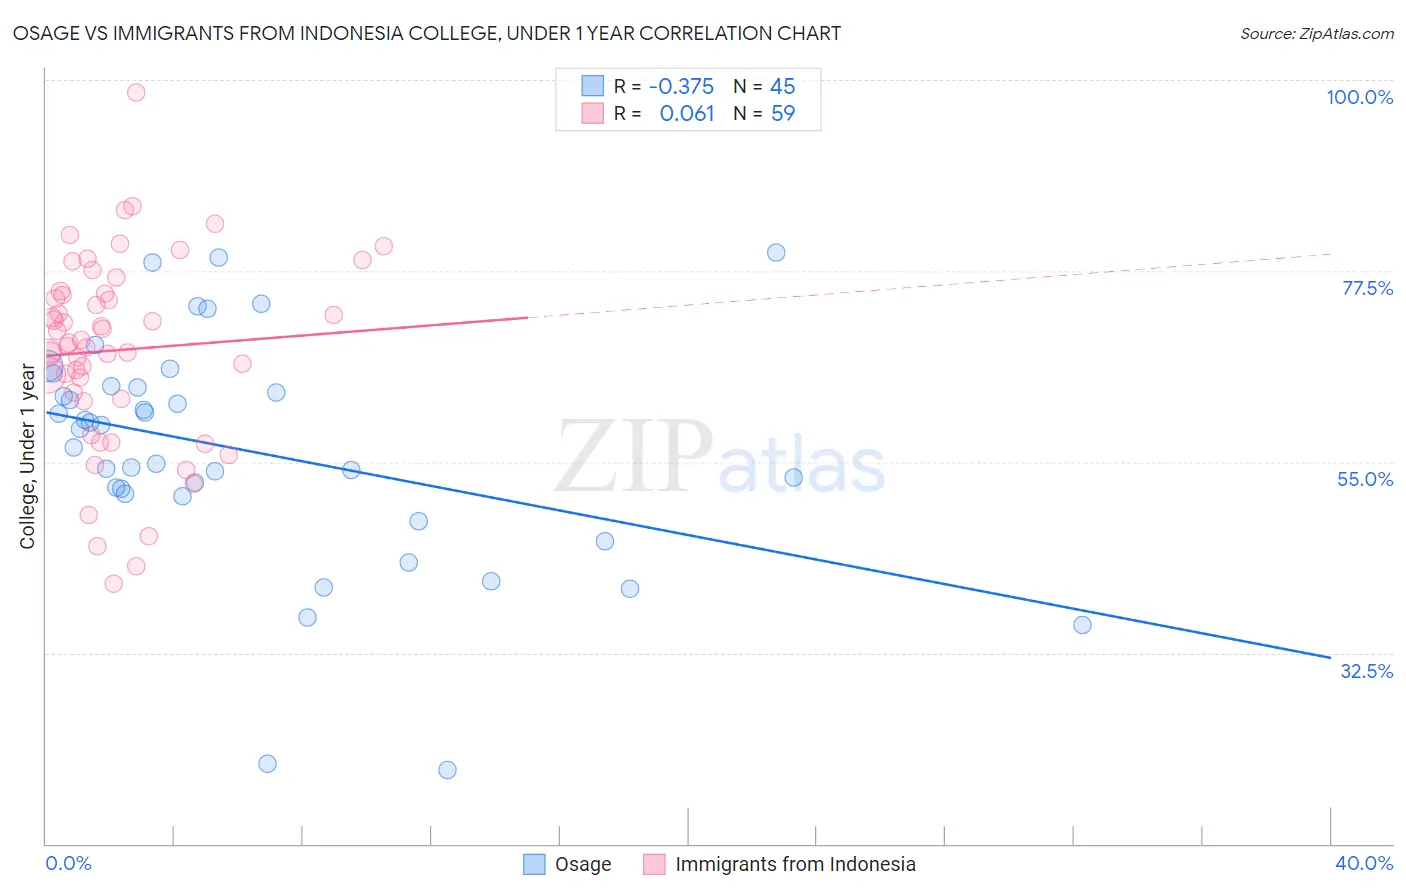
Osage vs Immigrants from Indonesia College, Under 1 year Correlation Chart
The statistical analysis conducted on geographies consisting of 91,808,929 people shows a mild negative correlation between the proportion of Osage and percentage of population with at least college, under 1 year education in the United States with a correlation coefficient (R) of -0.375 and weighted average of 62.7%. Similarly, the statistical analysis conducted on geographies consisting of 215,782,004 people shows a slight positive correlation between the proportion of Immigrants from Indonesia and percentage of population with at least college, under 1 year education in the United States with a correlation coefficient (R) of 0.061 and weighted average of 68.9%, a difference of 9.9%.
College, Under 1 year Correlation Summary
| Measurement | Osage | Immigrants from Indonesia |
| Minimum | 18.8% | 40.6% |
| Maximum | 79.7% | 98.6% |
| Range | 60.9% | 58.0% |
| Mean | 56.2% | 68.2% |
| Median | 58.9% | 69.0% |
| Interquartile 25% (IQ1) | 51.1% | 62.5% |
| Interquartile 75% (IQ3) | 63.8% | 74.8% |
| Interquartile Range (IQR) | 12.7% | 12.3% |
| Standard Deviation (Sample) | 13.5% | 11.3% |
| Standard Deviation (Population) | 13.4% | 11.2% |
Similar Demographics by College, Under 1 year
Demographics Similar to Osage by College, Under 1 year
In terms of college, under 1 year, the demographic groups most similar to Osage are Immigrants from Western Africa (62.8%, a difference of 0.11%), Iroquois (62.6%, a difference of 0.12%), Chippewa (62.6%, a difference of 0.15%), Spanish American (62.6%, a difference of 0.20%), and Immigrants (62.5%, a difference of 0.33%).
| Demographics | Rating | Rank | College, Under 1 year |
| Immigrants | Peru | 4.0 /100 | #225 | Tragic 63.1% |
| Immigrants | Colombia | 4.0 /100 | #226 | Tragic 63.1% |
| Immigrants | Ghana | 3.7 /100 | #227 | Tragic 63.1% |
| Samoans | 3.3 /100 | #228 | Tragic 63.0% |
| Liberians | 3.2 /100 | #229 | Tragic 63.0% |
| Immigrants | Nonimmigrants | 3.0 /100 | #230 | Tragic 62.9% |
| Immigrants | Western Africa | 2.4 /100 | #231 | Tragic 62.8% |
| Osage | 2.2 /100 | #232 | Tragic 62.7% |
| Iroquois | 2.0 /100 | #233 | Tragic 62.6% |
| Chippewa | 2.0 /100 | #234 | Tragic 62.6% |
| Spanish Americans | 1.9 /100 | #235 | Tragic 62.6% |
| Immigrants | Immigrants | 1.7 /100 | #236 | Tragic 62.5% |
| Immigrants | Burma/Myanmar | 1.6 /100 | #237 | Tragic 62.5% |
| French American Indians | 1.5 /100 | #238 | Tragic 62.4% |
| Nepalese | 1.1 /100 | #239 | Tragic 62.2% |
Demographics Similar to Immigrants from Indonesia by College, Under 1 year
In terms of college, under 1 year, the demographic groups most similar to Immigrants from Indonesia are Immigrants from Romania (68.9%, a difference of 0.020%), Immigrants from Zimbabwe (68.9%, a difference of 0.030%), Immigrants from North America (69.0%, a difference of 0.17%), Lithuanian (68.8%, a difference of 0.18%), and Immigrants from Europe (68.8%, a difference of 0.19%).
| Demographics | Rating | Rank | College, Under 1 year |
| Immigrants | Kazakhstan | 99.5 /100 | #61 | Exceptional 69.2% |
| Immigrants | Belarus | 99.5 /100 | #62 | Exceptional 69.2% |
| Immigrants | Canada | 99.4 /100 | #63 | Exceptional 69.1% |
| Northern Europeans | 99.4 /100 | #64 | Exceptional 69.0% |
| Immigrants | Moldova | 99.3 /100 | #65 | Exceptional 69.0% |
| Immigrants | North America | 99.3 /100 | #66 | Exceptional 69.0% |
| Immigrants | Zimbabwe | 99.2 /100 | #67 | Exceptional 68.9% |
| Immigrants | Indonesia | 99.2 /100 | #68 | Exceptional 68.9% |
| Immigrants | Romania | 99.2 /100 | #69 | Exceptional 68.9% |
| Lithuanians | 99.1 /100 | #70 | Exceptional 68.8% |
| Immigrants | Europe | 99.1 /100 | #71 | Exceptional 68.8% |
| Bolivians | 99.0 /100 | #72 | Exceptional 68.7% |
| Immigrants | England | 99.0 /100 | #73 | Exceptional 68.7% |
| Swedes | 98.9 /100 | #74 | Exceptional 68.7% |
| Immigrants | Western Europe | 98.6 /100 | #75 | Exceptional 68.5% |