Immigrants from Malaysia vs Asian Family Poverty
COMPARE
Immigrants from Malaysia
Asian
Family Poverty
Family Poverty Comparison
Immigrants from Malaysia
Asians
8.5%
FAMILY POVERTY
86.5/ 100
METRIC RATING
135th/ 347
METRIC RANK
7.7%
FAMILY POVERTY
98.7/ 100
METRIC RATING
57th/ 347
METRIC RANK
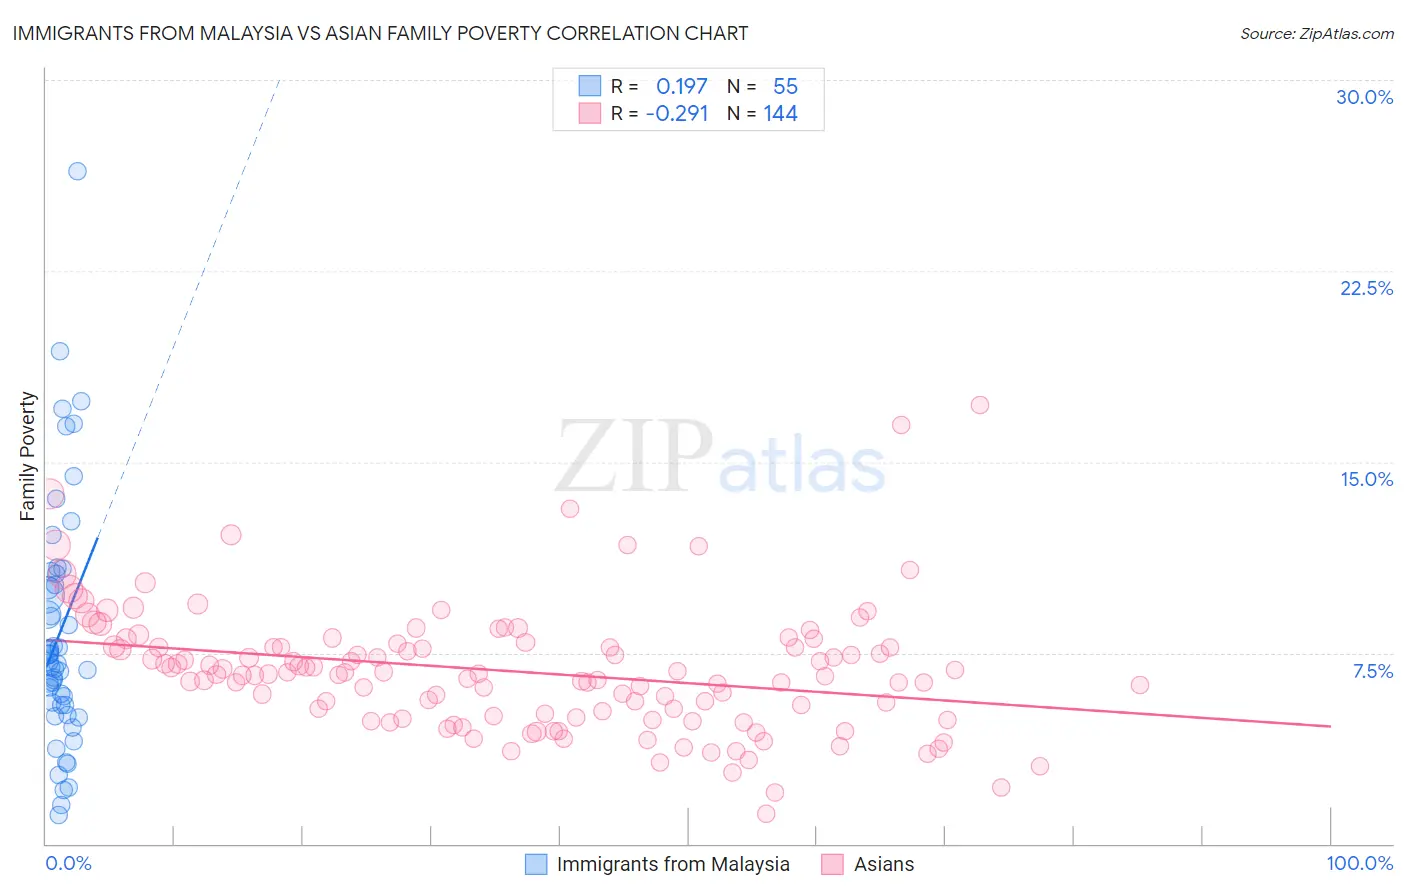
Immigrants from Malaysia vs Asian Family Poverty Correlation Chart
The statistical analysis conducted on geographies consisting of 197,782,180 people shows a poor positive correlation between the proportion of Immigrants from Malaysia and poverty level among families in the United States with a correlation coefficient (R) of 0.197 and weighted average of 8.5%. Similarly, the statistical analysis conducted on geographies consisting of 547,164,240 people shows a weak negative correlation between the proportion of Asians and poverty level among families in the United States with a correlation coefficient (R) of -0.291 and weighted average of 7.7%, a difference of 9.5%.
Family Poverty Correlation Summary
| Measurement | Immigrants from Malaysia | Asian |
| Minimum | 1.1% | 1.2% |
| Maximum | 26.4% | 17.3% |
| Range | 25.3% | 16.1% |
| Mean | 8.3% | 6.8% |
| Median | 7.1% | 6.7% |
| Interquartile 25% (IQ1) | 5.4% | 5.0% |
| Interquartile 75% (IQ3) | 10.6% | 7.7% |
| Interquartile Range (IQR) | 5.2% | 2.7% |
| Standard Deviation (Sample) | 4.9% | 2.5% |
| Standard Deviation (Population) | 4.8% | 2.5% |
Similar Demographics by Family Poverty
Demographics Similar to Immigrants from Malaysia by Family Poverty
In terms of family poverty, the demographic groups most similar to Immigrants from Malaysia are Chilean (8.5%, a difference of 0.040%), Immigrants from Brazil (8.5%, a difference of 0.040%), Sri Lankan (8.5%, a difference of 0.050%), Immigrants from Southern Europe (8.5%, a difference of 0.12%), and Armenian (8.5%, a difference of 0.52%).
| Demographics | Rating | Rank | Family Poverty |
| Argentineans | 89.6 /100 | #128 | Excellent 8.4% |
| Portuguese | 89.2 /100 | #129 | Excellent 8.4% |
| Immigrants | Bosnia and Herzegovina | 88.6 /100 | #130 | Excellent 8.4% |
| Puget Sound Salish | 88.6 /100 | #131 | Excellent 8.4% |
| Immigrants | Argentina | 88.2 /100 | #132 | Excellent 8.4% |
| Sri Lankans | 86.6 /100 | #133 | Excellent 8.5% |
| Chileans | 86.6 /100 | #134 | Excellent 8.5% |
| Immigrants | Malaysia | 86.5 /100 | #135 | Excellent 8.5% |
| Immigrants | Brazil | 86.3 /100 | #136 | Excellent 8.5% |
| Immigrants | Southern Europe | 86.0 /100 | #137 | Excellent 8.5% |
| Armenians | 84.6 /100 | #138 | Excellent 8.5% |
| Immigrants | Nepal | 84.2 /100 | #139 | Excellent 8.5% |
| Immigrants | Kazakhstan | 84.1 /100 | #140 | Excellent 8.5% |
| Immigrants | Ukraine | 83.9 /100 | #141 | Excellent 8.5% |
| Yugoslavians | 83.5 /100 | #142 | Excellent 8.5% |
Demographics Similar to Asians by Family Poverty
In terms of family poverty, the demographic groups most similar to Asians are Finnish (7.7%, a difference of 0.030%), European (7.7%, a difference of 0.040%), Immigrants from Greece (7.7%, a difference of 0.050%), Immigrants from Serbia (7.7%, a difference of 0.090%), and Immigrants from Eastern Asia (7.7%, a difference of 0.13%).
| Demographics | Rating | Rank | Family Poverty |
| Immigrants | North Macedonia | 98.9 /100 | #50 | Exceptional 7.7% |
| Immigrants | Moldova | 98.8 /100 | #51 | Exceptional 7.7% |
| Indians (Asian) | 98.8 /100 | #52 | Exceptional 7.7% |
| Swiss | 98.8 /100 | #53 | Exceptional 7.7% |
| Immigrants | Sweden | 98.8 /100 | #54 | Exceptional 7.7% |
| Immigrants | Eastern Asia | 98.7 /100 | #55 | Exceptional 7.7% |
| Immigrants | Serbia | 98.7 /100 | #56 | Exceptional 7.7% |
| Asians | 98.7 /100 | #57 | Exceptional 7.7% |
| Finns | 98.7 /100 | #58 | Exceptional 7.7% |
| Europeans | 98.7 /100 | #59 | Exceptional 7.7% |
| Immigrants | Greece | 98.7 /100 | #60 | Exceptional 7.7% |
| Immigrants | Netherlands | 98.6 /100 | #61 | Exceptional 7.7% |
| Macedonians | 98.6 /100 | #62 | Exceptional 7.8% |
| Zimbabweans | 98.4 /100 | #63 | Exceptional 7.8% |
| Koreans | 98.3 /100 | #64 | Exceptional 7.8% |