European vs Zimbabwean Child Poverty Among Girls Under 16
COMPARE
European
Zimbabwean
Child Poverty Among Girls Under 16
Child Poverty Among Girls Under 16 Comparison
Europeans
Zimbabweans
14.6%
CHILD POVERTY AMONG GIRLS UNDER 16
98.1/ 100
METRIC RATING
70th/ 347
METRIC RANK
14.4%
CHILD POVERTY AMONG GIRLS UNDER 16
98.8/ 100
METRIC RATING
59th/ 347
METRIC RANK
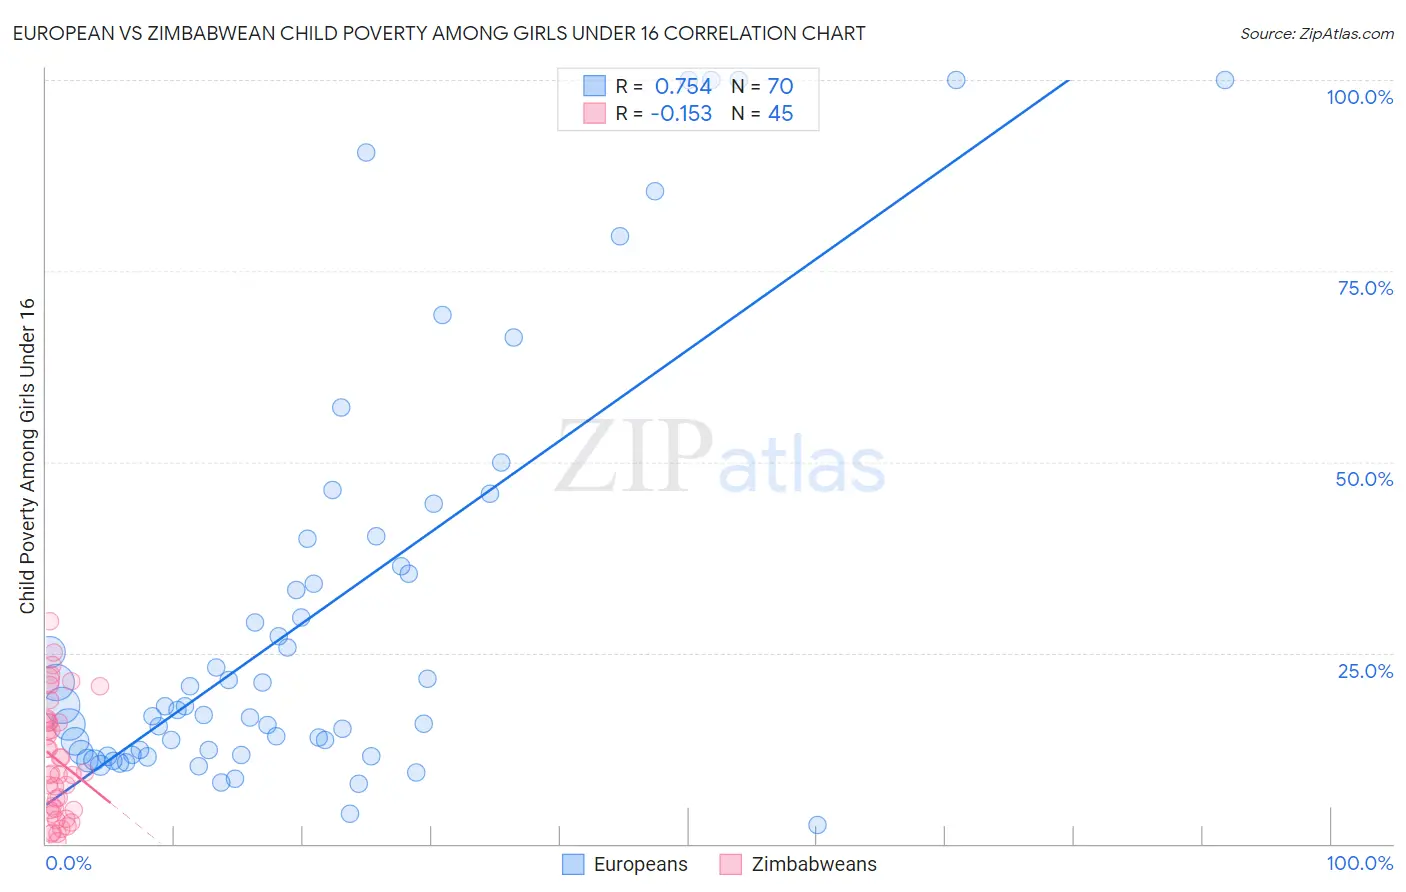
European vs Zimbabwean Child Poverty Among Girls Under 16 Correlation Chart
The statistical analysis conducted on geographies consisting of 541,040,111 people shows a strong positive correlation between the proportion of Europeans and poverty level among girls under the age of 16 in the United States with a correlation coefficient (R) of 0.754 and weighted average of 14.6%. Similarly, the statistical analysis conducted on geographies consisting of 69,044,520 people shows a poor negative correlation between the proportion of Zimbabweans and poverty level among girls under the age of 16 in the United States with a correlation coefficient (R) of -0.153 and weighted average of 14.4%, a difference of 1.5%.
Child Poverty Among Girls Under 16 Correlation Summary
| Measurement | European | Zimbabwean |
| Minimum | 2.4% | 0.32% |
| Maximum | 100.0% | 29.1% |
| Range | 97.6% | 28.8% |
| Mean | 29.9% | 11.0% |
| Median | 17.7% | 9.2% |
| Interquartile 25% (IQ1) | 11.7% | 4.4% |
| Interquartile 75% (IQ3) | 36.4% | 16.0% |
| Interquartile Range (IQR) | 24.7% | 11.7% |
| Standard Deviation (Sample) | 27.3% | 7.5% |
| Standard Deviation (Population) | 27.1% | 7.4% |
Demographics Similar to Europeans and Zimbabweans by Child Poverty Among Girls Under 16
In terms of child poverty among girls under 16, the demographic groups most similar to Europeans are Slovene (14.6%, a difference of 0.040%), Immigrants from Netherlands (14.6%, a difference of 0.060%), Immigrants from Poland (14.6%, a difference of 0.12%), Immigrants from Austria (14.6%, a difference of 0.16%), and Taiwanese (14.6%, a difference of 0.19%). Similarly, the demographic groups most similar to Zimbabweans are Immigrants from Bulgaria (14.4%, a difference of 0.060%), Immigrants from Serbia (14.4%, a difference of 0.15%), Immigrants from Indonesia (14.4%, a difference of 0.19%), Polish (14.4%, a difference of 0.19%), and Cambodian (14.4%, a difference of 0.20%).
| Demographics | Rating | Rank | Child Poverty Among Girls Under 16 |
| Estonians | 98.9 /100 | #54 | Exceptional 14.3% |
| Immigrants | Romania | 98.9 /100 | #55 | Exceptional 14.3% |
| Immigrants | Indonesia | 98.9 /100 | #56 | Exceptional 14.4% |
| Immigrants | Serbia | 98.9 /100 | #57 | Exceptional 14.4% |
| Immigrants | Bulgaria | 98.8 /100 | #58 | Exceptional 14.4% |
| Zimbabweans | 98.8 /100 | #59 | Exceptional 14.4% |
| Poles | 98.7 /100 | #60 | Exceptional 14.4% |
| Cambodians | 98.7 /100 | #61 | Exceptional 14.4% |
| Scandinavians | 98.7 /100 | #62 | Exceptional 14.4% |
| Immigrants | Europe | 98.7 /100 | #63 | Exceptional 14.4% |
| Immigrants | Philippines | 98.6 /100 | #64 | Exceptional 14.4% |
| Immigrants | Sweden | 98.6 /100 | #65 | Exceptional 14.5% |
| Immigrants | Belgium | 98.5 /100 | #66 | Exceptional 14.5% |
| Laotians | 98.4 /100 | #67 | Exceptional 14.5% |
| Immigrants | Argentina | 98.3 /100 | #68 | Exceptional 14.6% |
| Immigrants | Poland | 98.2 /100 | #69 | Exceptional 14.6% |
| Europeans | 98.1 /100 | #70 | Exceptional 14.6% |
| Slovenes | 98.1 /100 | #71 | Exceptional 14.6% |
| Immigrants | Netherlands | 98.1 /100 | #72 | Exceptional 14.6% |
| Immigrants | Austria | 98.0 /100 | #73 | Exceptional 14.6% |
| Taiwanese | 98.0 /100 | #74 | Exceptional 14.6% |