Northern European vs Senegalese Seniors Poverty Over the Age of 65
COMPARE
Northern European
Senegalese
Seniors Poverty Over the Age of 65
Seniors Poverty Over the Age of 65 Comparison
Northern Europeans
Senegalese
9.4%
SENIORS POVERTY OVER THE AGE OF 65
99.8/ 100
METRIC RATING
32nd/ 347
METRIC RANK
13.3%
SENIORS POVERTY OVER THE AGE OF 65
0.0/ 100
METRIC RATING
282nd/ 347
METRIC RANK
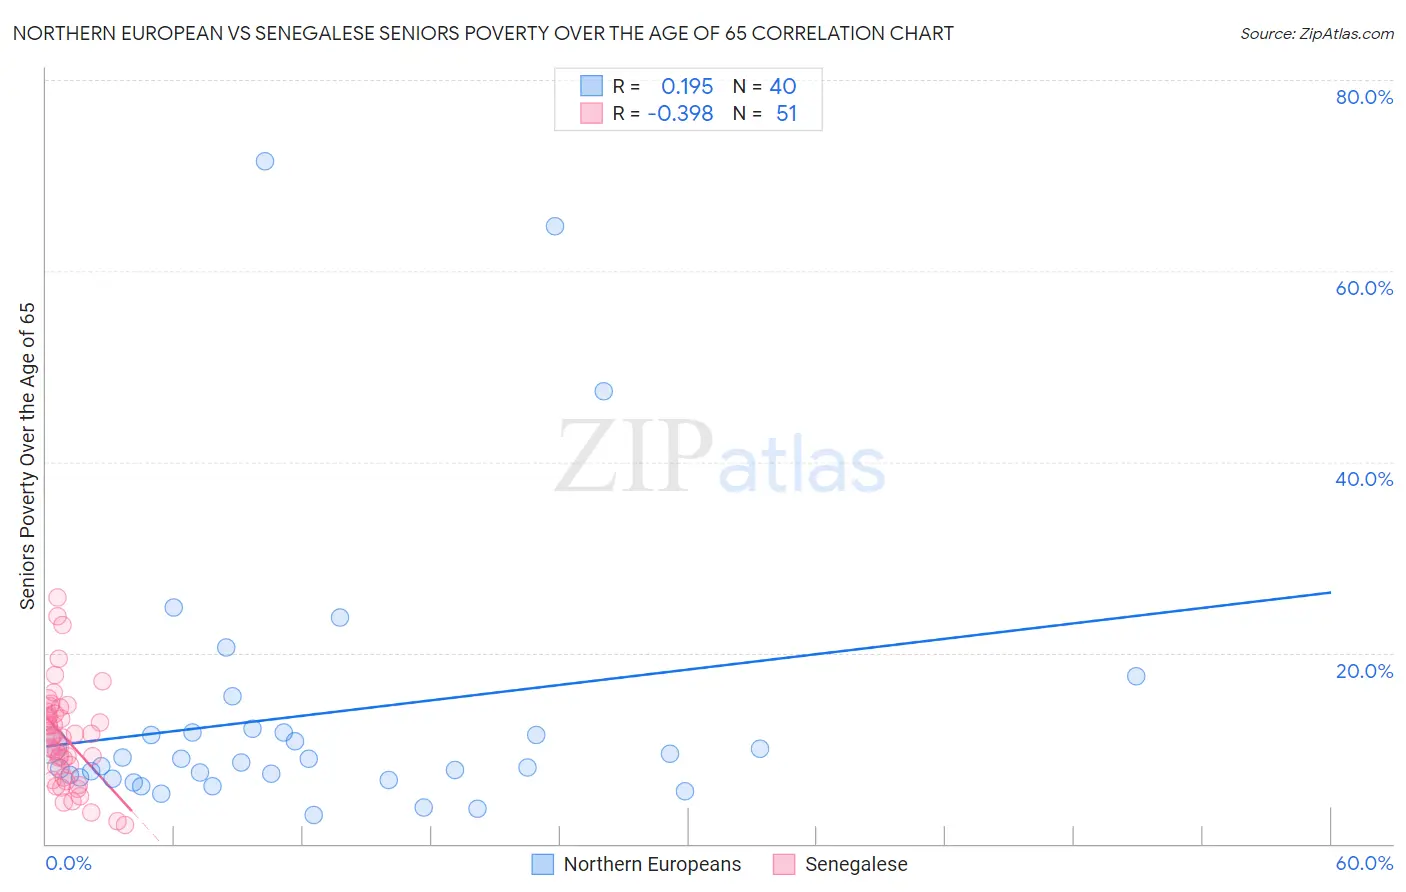
Northern European vs Senegalese Seniors Poverty Over the Age of 65 Correlation Chart
The statistical analysis conducted on geographies consisting of 404,631,696 people shows a poor positive correlation between the proportion of Northern Europeans and poverty level among seniors over the age of 65 in the United States with a correlation coefficient (R) of 0.195 and weighted average of 9.4%. Similarly, the statistical analysis conducted on geographies consisting of 77,978,779 people shows a mild negative correlation between the proportion of Senegalese and poverty level among seniors over the age of 65 in the United States with a correlation coefficient (R) of -0.398 and weighted average of 13.3%, a difference of 41.1%.
Seniors Poverty Over the Age of 65 Correlation Summary
| Measurement | Northern European | Senegalese |
| Minimum | 3.0% | 1.9% |
| Maximum | 71.5% | 25.8% |
| Range | 68.5% | 23.9% |
| Mean | 13.5% | 11.1% |
| Median | 8.7% | 11.1% |
| Interquartile 25% (IQ1) | 6.9% | 7.0% |
| Interquartile 75% (IQ3) | 11.6% | 13.7% |
| Interquartile Range (IQR) | 4.7% | 6.7% |
| Standard Deviation (Sample) | 14.8% | 5.2% |
| Standard Deviation (Population) | 14.6% | 5.1% |
Similar Demographics by Seniors Poverty Over the Age of 65
Demographics Similar to Northern Europeans by Seniors Poverty Over the Age of 65
In terms of seniors poverty over the age of 65, the demographic groups most similar to Northern Europeans are Native Hawaiian (9.4%, a difference of 0.020%), British (9.4%, a difference of 0.12%), Finnish (9.4%, a difference of 0.28%), Menominee (9.4%, a difference of 0.50%), and Latvian (9.5%, a difference of 0.50%).
| Demographics | Rating | Rank | Seniors Poverty Over the Age of 65 |
| Irish | 99.9 /100 | #25 | Exceptional 9.3% |
| Immigrants | Scotland | 99.9 /100 | #26 | Exceptional 9.3% |
| Italians | 99.9 /100 | #27 | Exceptional 9.3% |
| Tongans | 99.9 /100 | #28 | Exceptional 9.3% |
| Bhutanese | 99.9 /100 | #29 | Exceptional 9.3% |
| Menominee | 99.8 /100 | #30 | Exceptional 9.4% |
| Finns | 99.8 /100 | #31 | Exceptional 9.4% |
| Northern Europeans | 99.8 /100 | #32 | Exceptional 9.4% |
| Native Hawaiians | 99.8 /100 | #33 | Exceptional 9.4% |
| British | 99.8 /100 | #34 | Exceptional 9.4% |
| Latvians | 99.8 /100 | #35 | Exceptional 9.5% |
| Czechoslovakians | 99.8 /100 | #36 | Exceptional 9.5% |
| Scotch-Irish | 99.7 /100 | #37 | Exceptional 9.5% |
| Belgians | 99.7 /100 | #38 | Exceptional 9.5% |
| Greeks | 99.6 /100 | #39 | Exceptional 9.6% |
Demographics Similar to Senegalese by Seniors Poverty Over the Age of 65
In terms of seniors poverty over the age of 65, the demographic groups most similar to Senegalese are Central American (13.4%, a difference of 0.82%), Immigrants from El Salvador (13.1%, a difference of 1.1%), Yuman (13.1%, a difference of 1.5%), Mexican (13.1%, a difference of 1.6%), and Immigrants from Bahamas (13.0%, a difference of 1.7%).
| Demographics | Rating | Rank | Seniors Poverty Over the Age of 65 |
| Immigrants | Colombia | 0.0 /100 | #275 | Tragic 12.9% |
| Immigrants | Azores | 0.0 /100 | #276 | Tragic 12.9% |
| Paiute | 0.0 /100 | #277 | Tragic 12.9% |
| Immigrants | Bahamas | 0.0 /100 | #278 | Tragic 13.0% |
| Mexicans | 0.0 /100 | #279 | Tragic 13.1% |
| Yuman | 0.0 /100 | #280 | Tragic 13.1% |
| Immigrants | El Salvador | 0.0 /100 | #281 | Tragic 13.1% |
| Senegalese | 0.0 /100 | #282 | Tragic 13.3% |
| Central Americans | 0.0 /100 | #283 | Tragic 13.4% |
| Colville | 0.0 /100 | #284 | Tragic 13.5% |
| Guatemalans | 0.0 /100 | #285 | Tragic 13.5% |
| Immigrants | Senegal | 0.0 /100 | #286 | Tragic 13.6% |
| Immigrants | Mexico | 0.0 /100 | #287 | Tragic 13.6% |
| Belizeans | 0.0 /100 | #288 | Tragic 13.6% |
| Jamaicans | 0.0 /100 | #289 | Tragic 13.6% |