Northern European vs Immigrants from Bosnia and Herzegovina Female Poverty Among 25-34 Year Olds
COMPARE
Northern European
Immigrants from Bosnia and Herzegovina
Female Poverty Among 25-34 Year Olds
Female Poverty Among 25-34 Year Olds Comparison
Northern Europeans
Immigrants from Bosnia and Herzegovina
13.2%
FEMALE POVERTY AMONG 25-34 YEAR OLDS
73.7/ 100
METRIC RATING
153rd/ 347
METRIC RANK
13.4%
FEMALE POVERTY AMONG 25-34 YEAR OLDS
58.6/ 100
METRIC RATING
167th/ 347
METRIC RANK
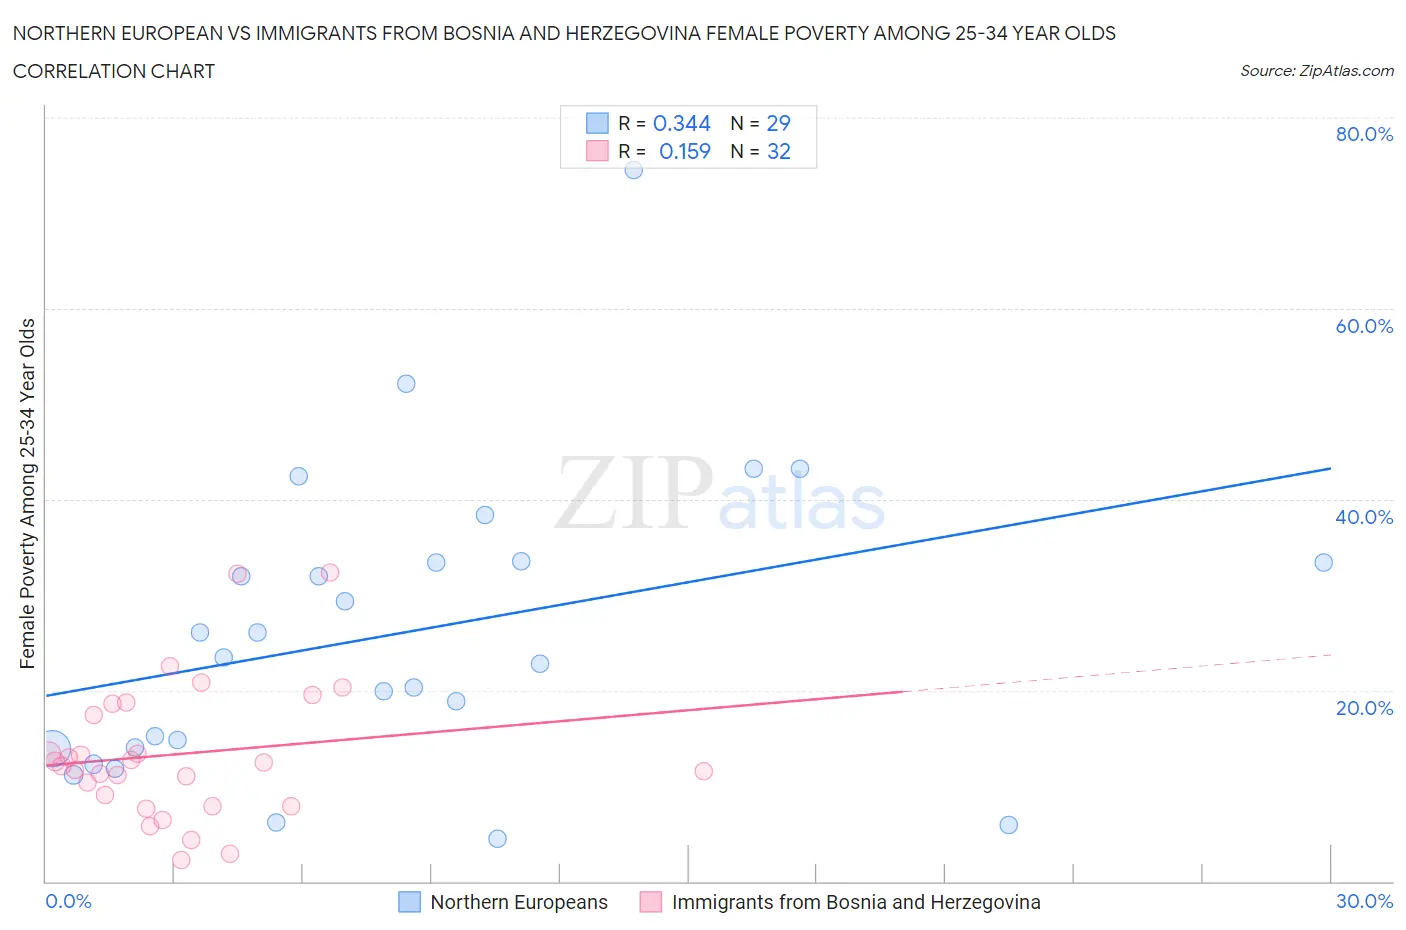
Northern European vs Immigrants from Bosnia and Herzegovina Female Poverty Among 25-34 Year Olds Correlation Chart
The statistical analysis conducted on geographies consisting of 397,775,454 people shows a mild positive correlation between the proportion of Northern Europeans and poverty level among females between the ages 25 and 34 in the United States with a correlation coefficient (R) of 0.344 and weighted average of 13.2%. Similarly, the statistical analysis conducted on geographies consisting of 155,781,915 people shows a poor positive correlation between the proportion of Immigrants from Bosnia and Herzegovina and poverty level among females between the ages 25 and 34 in the United States with a correlation coefficient (R) of 0.159 and weighted average of 13.4%, a difference of 1.4%.
Female Poverty Among 25-34 Year Olds Correlation Summary
| Measurement | Northern European | Immigrants from Bosnia and Herzegovina |
| Minimum | 4.5% | 2.2% |
| Maximum | 74.5% | 32.4% |
| Range | 70.1% | 30.2% |
| Mean | 26.0% | 13.3% |
| Median | 23.5% | 12.2% |
| Interquartile 25% (IQ1) | 13.9% | 8.5% |
| Interquartile 75% (IQ3) | 33.4% | 18.0% |
| Interquartile Range (IQR) | 19.5% | 9.5% |
| Standard Deviation (Sample) | 15.6% | 7.1% |
| Standard Deviation (Population) | 15.4% | 7.0% |
Demographics Similar to Northern Europeans and Immigrants from Bosnia and Herzegovina by Female Poverty Among 25-34 Year Olds
In terms of female poverty among 25-34 year olds, the demographic groups most similar to Northern Europeans are Arab (13.2%, a difference of 0.020%), Immigrants from Sierra Leone (13.3%, a difference of 0.090%), Immigrants from Cameroon (13.3%, a difference of 0.18%), Slavic (13.2%, a difference of 0.23%), and Costa Rican (13.2%, a difference of 0.24%). Similarly, the demographic groups most similar to Immigrants from Bosnia and Herzegovina are Belgian (13.4%, a difference of 0.020%), Basque (13.4%, a difference of 0.060%), Immigrants from Afghanistan (13.4%, a difference of 0.080%), Samoan (13.5%, a difference of 0.16%), and Swiss (13.4%, a difference of 0.27%).
| Demographics | Rating | Rank | Female Poverty Among 25-34 Year Olds |
| Iraqis | 76.0 /100 | #150 | Good 13.2% |
| Costa Ricans | 75.8 /100 | #151 | Good 13.2% |
| Slavs | 75.7 /100 | #152 | Good 13.2% |
| Northern Europeans | 73.7 /100 | #153 | Good 13.2% |
| Arabs | 73.5 /100 | #154 | Good 13.2% |
| Immigrants | Sierra Leone | 72.9 /100 | #155 | Good 13.3% |
| Immigrants | Cameroon | 72.0 /100 | #156 | Good 13.3% |
| Immigrants | Western Europe | 70.3 /100 | #157 | Good 13.3% |
| Immigrants | Colombia | 69.2 /100 | #158 | Good 13.3% |
| Uruguayans | 66.9 /100 | #159 | Good 13.3% |
| Immigrants | South America | 66.3 /100 | #160 | Good 13.3% |
| Icelanders | 65.7 /100 | #161 | Good 13.3% |
| Ugandans | 64.1 /100 | #162 | Good 13.4% |
| British | 63.5 /100 | #163 | Good 13.4% |
| Swiss | 61.7 /100 | #164 | Good 13.4% |
| Basques | 59.3 /100 | #165 | Average 13.4% |
| Belgians | 58.9 /100 | #166 | Average 13.4% |
| Immigrants | Bosnia and Herzegovina | 58.6 /100 | #167 | Average 13.4% |
| Immigrants | Afghanistan | 57.7 /100 | #168 | Average 13.4% |
| Samoans | 56.8 /100 | #169 | Average 13.5% |
| Immigrants | Uganda | 53.0 /100 | #170 | Average 13.5% |