Northern European vs Belizean Female Poverty Among 25-34 Year Olds
COMPARE
Northern European
Belizean
Female Poverty Among 25-34 Year Olds
Female Poverty Among 25-34 Year Olds Comparison
Northern Europeans
Belizeans
13.2%
FEMALE POVERTY AMONG 25-34 YEAR OLDS
73.7/ 100
METRIC RATING
153rd/ 347
METRIC RANK
15.1%
FEMALE POVERTY AMONG 25-34 YEAR OLDS
0.4/ 100
METRIC RATING
252nd/ 347
METRIC RANK
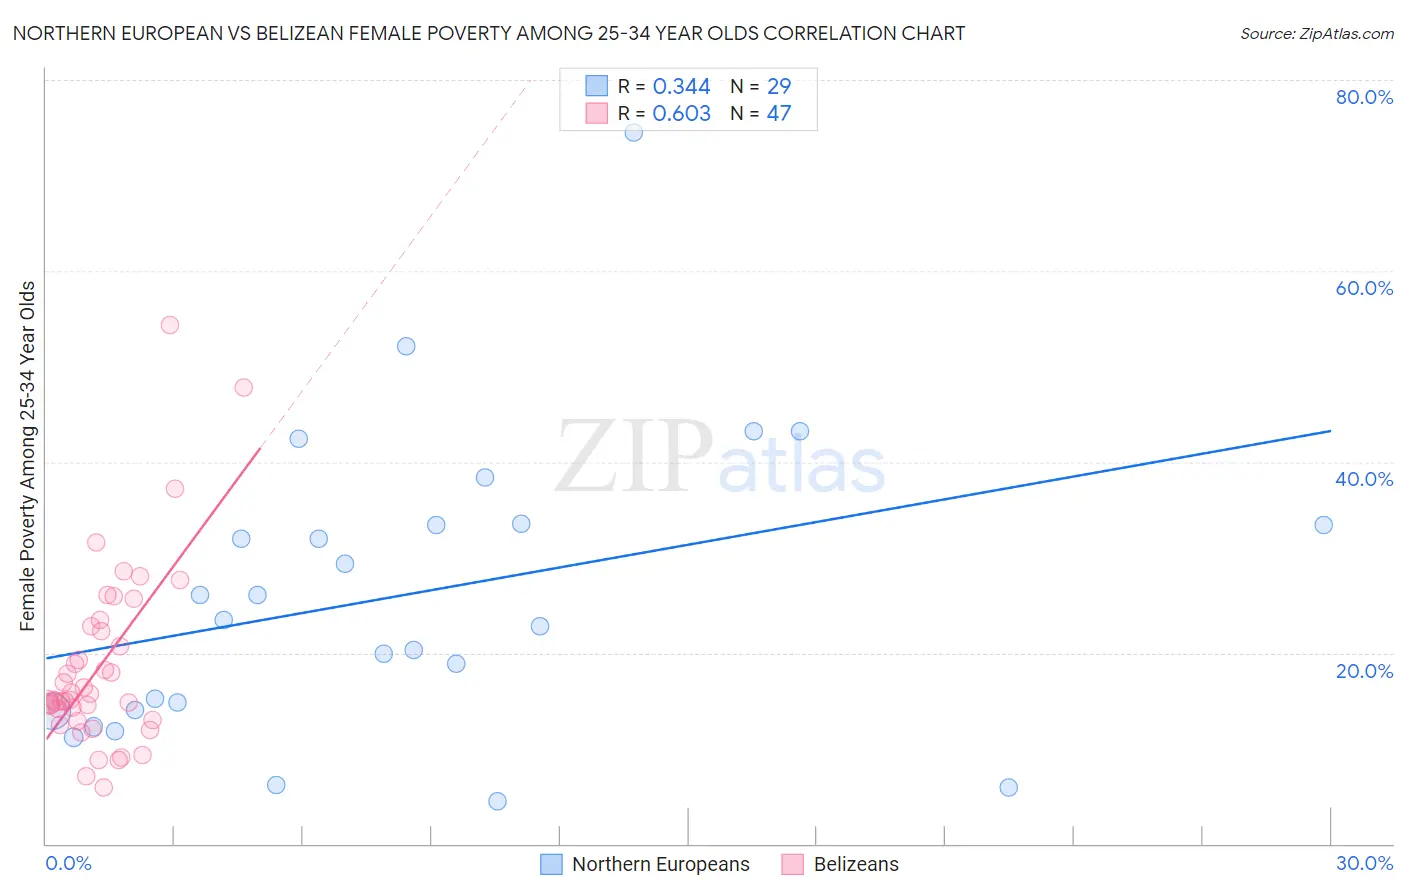
Northern European vs Belizean Female Poverty Among 25-34 Year Olds Correlation Chart
The statistical analysis conducted on geographies consisting of 397,775,454 people shows a mild positive correlation between the proportion of Northern Europeans and poverty level among females between the ages 25 and 34 in the United States with a correlation coefficient (R) of 0.344 and weighted average of 13.2%. Similarly, the statistical analysis conducted on geographies consisting of 143,799,861 people shows a significant positive correlation between the proportion of Belizeans and poverty level among females between the ages 25 and 34 in the United States with a correlation coefficient (R) of 0.603 and weighted average of 15.1%, a difference of 13.7%.
Female Poverty Among 25-34 Year Olds Correlation Summary
| Measurement | Northern European | Belizean |
| Minimum | 4.5% | 6.0% |
| Maximum | 74.5% | 54.4% |
| Range | 70.1% | 48.4% |
| Mean | 26.0% | 18.7% |
| Median | 23.5% | 15.1% |
| Interquartile 25% (IQ1) | 13.9% | 13.0% |
| Interquartile 75% (IQ3) | 33.4% | 22.8% |
| Interquartile Range (IQR) | 19.5% | 9.8% |
| Standard Deviation (Sample) | 15.6% | 9.6% |
| Standard Deviation (Population) | 15.4% | 9.5% |
Similar Demographics by Female Poverty Among 25-34 Year Olds
Demographics Similar to Northern Europeans by Female Poverty Among 25-34 Year Olds
In terms of female poverty among 25-34 year olds, the demographic groups most similar to Northern Europeans are Arab (13.2%, a difference of 0.020%), Immigrants from Sierra Leone (13.3%, a difference of 0.090%), Immigrants from Cameroon (13.3%, a difference of 0.18%), Slavic (13.2%, a difference of 0.23%), and Costa Rican (13.2%, a difference of 0.24%).
| Demographics | Rating | Rank | Female Poverty Among 25-34 Year Olds |
| South Americans | 76.9 /100 | #146 | Good 13.2% |
| Europeans | 76.8 /100 | #147 | Good 13.2% |
| Lebanese | 76.8 /100 | #148 | Good 13.2% |
| Sierra Leoneans | 76.3 /100 | #149 | Good 13.2% |
| Iraqis | 76.0 /100 | #150 | Good 13.2% |
| Costa Ricans | 75.8 /100 | #151 | Good 13.2% |
| Slavs | 75.7 /100 | #152 | Good 13.2% |
| Northern Europeans | 73.7 /100 | #153 | Good 13.2% |
| Arabs | 73.5 /100 | #154 | Good 13.2% |
| Immigrants | Sierra Leone | 72.9 /100 | #155 | Good 13.3% |
| Immigrants | Cameroon | 72.0 /100 | #156 | Good 13.3% |
| Immigrants | Western Europe | 70.3 /100 | #157 | Good 13.3% |
| Immigrants | Colombia | 69.2 /100 | #158 | Good 13.3% |
| Uruguayans | 66.9 /100 | #159 | Good 13.3% |
| Immigrants | South America | 66.3 /100 | #160 | Good 13.3% |
Demographics Similar to Belizeans by Female Poverty Among 25-34 Year Olds
In terms of female poverty among 25-34 year olds, the demographic groups most similar to Belizeans are Immigrants from West Indies (15.1%, a difference of 0.14%), Haitian (15.0%, a difference of 0.17%), Somali (15.1%, a difference of 0.22%), Immigrants from El Salvador (15.0%, a difference of 0.36%), and Immigrants from Haiti (15.0%, a difference of 0.39%).
| Demographics | Rating | Rank | Female Poverty Among 25-34 Year Olds |
| Immigrants | Middle Africa | 1.0 /100 | #245 | Tragic 14.8% |
| Jamaicans | 1.0 /100 | #246 | Tragic 14.8% |
| German Russians | 0.8 /100 | #247 | Tragic 14.9% |
| Immigrants | Western Africa | 0.8 /100 | #248 | Tragic 14.9% |
| Immigrants | Haiti | 0.5 /100 | #249 | Tragic 15.0% |
| Immigrants | El Salvador | 0.5 /100 | #250 | Tragic 15.0% |
| Haitians | 0.5 /100 | #251 | Tragic 15.0% |
| Belizeans | 0.4 /100 | #252 | Tragic 15.1% |
| Immigrants | West Indies | 0.4 /100 | #253 | Tragic 15.1% |
| Somalis | 0.4 /100 | #254 | Tragic 15.1% |
| Immigrants | Laos | 0.3 /100 | #255 | Tragic 15.2% |
| West Indians | 0.3 /100 | #256 | Tragic 15.2% |
| Immigrants | Burma/Myanmar | 0.3 /100 | #257 | Tragic 15.2% |
| Nepalese | 0.2 /100 | #258 | Tragic 15.2% |
| Immigrants | Cuba | 0.2 /100 | #259 | Tragic 15.2% |