Northern European vs Immigrants from Jamaica Family Poverty
COMPARE
Northern European
Immigrants from Jamaica
Family Poverty
Family Poverty Comparison
Northern Europeans
Immigrants from Jamaica
7.8%
FAMILY POVERTY
98.3/ 100
METRIC RATING
67th/ 347
METRIC RANK
11.2%
FAMILY POVERTY
0.1/ 100
METRIC RATING
272nd/ 347
METRIC RANK
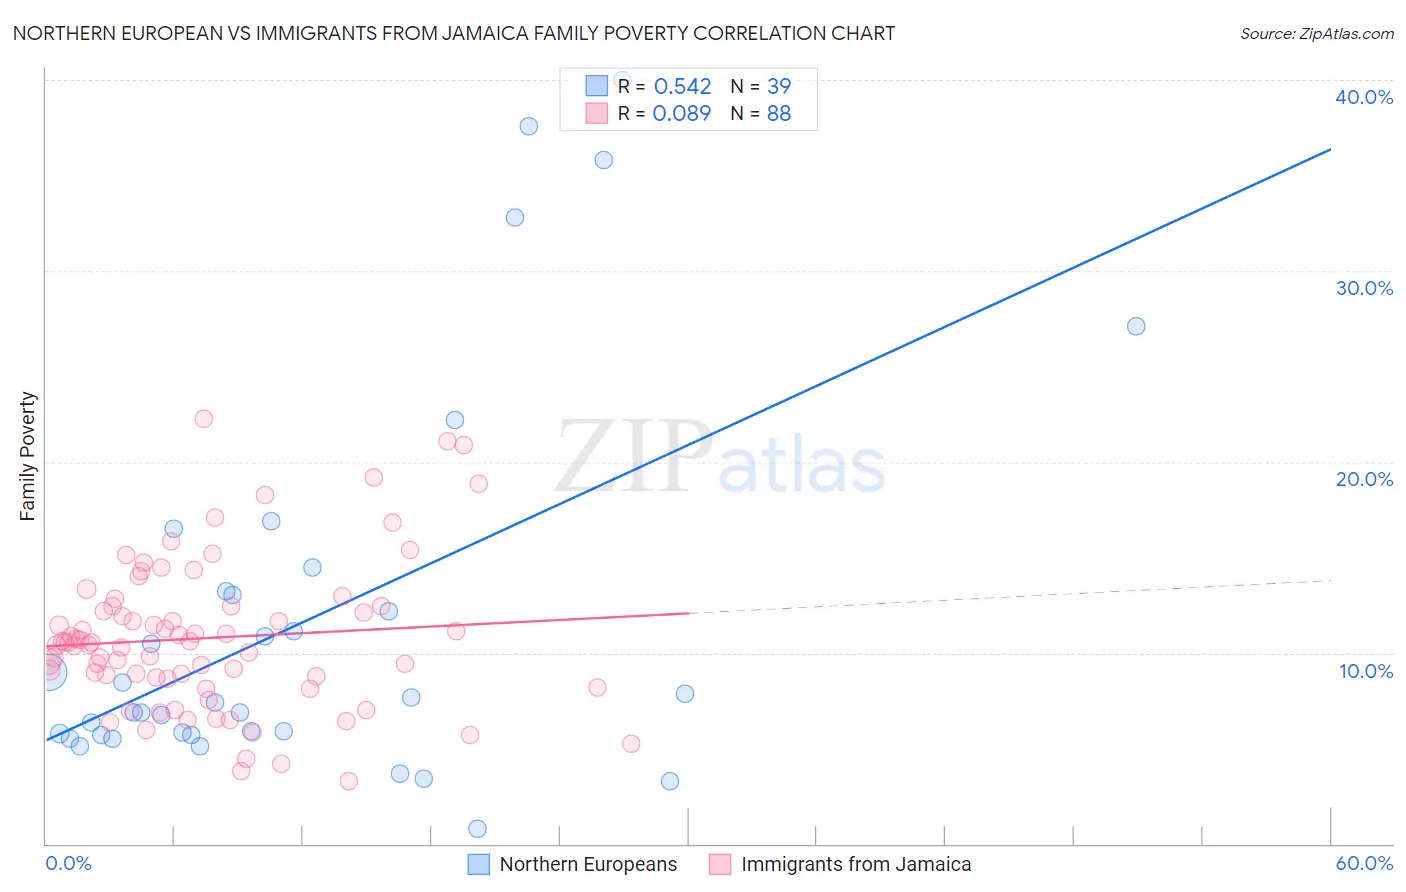
Northern European vs Immigrants from Jamaica Family Poverty Correlation Chart
The statistical analysis conducted on geographies consisting of 404,830,056 people shows a substantial positive correlation between the proportion of Northern Europeans and poverty level among families in the United States with a correlation coefficient (R) of 0.542 and weighted average of 7.8%. Similarly, the statistical analysis conducted on geographies consisting of 301,099,868 people shows a slight positive correlation between the proportion of Immigrants from Jamaica and poverty level among families in the United States with a correlation coefficient (R) of 0.089 and weighted average of 11.2%, a difference of 42.7%.
Family Poverty Correlation Summary
| Measurement | Northern European | Immigrants from Jamaica |
| Minimum | 0.78% | 3.3% |
| Maximum | 40.0% | 22.2% |
| Range | 39.2% | 19.0% |
| Mean | 11.7% | 10.8% |
| Median | 7.4% | 10.5% |
| Interquartile 25% (IQ1) | 5.7% | 8.7% |
| Interquartile 75% (IQ3) | 13.2% | 12.4% |
| Interquartile Range (IQR) | 7.5% | 3.7% |
| Standard Deviation (Sample) | 10.0% | 3.9% |
| Standard Deviation (Population) | 9.9% | 3.9% |
Similar Demographics by Family Poverty
Demographics Similar to Northern Europeans by Family Poverty
In terms of family poverty, the demographic groups most similar to Northern Europeans are Dutch (7.8%, a difference of 0.010%), Australian (7.8%, a difference of 0.030%), Immigrants from Belgium (7.8%, a difference of 0.050%), Immigrants from Bulgaria (7.8%, a difference of 0.070%), and Korean (7.8%, a difference of 0.080%).
| Demographics | Rating | Rank | Family Poverty |
| Immigrants | Greece | 98.7 /100 | #60 | Exceptional 7.7% |
| Immigrants | Netherlands | 98.6 /100 | #61 | Exceptional 7.7% |
| Macedonians | 98.6 /100 | #62 | Exceptional 7.8% |
| Zimbabweans | 98.4 /100 | #63 | Exceptional 7.8% |
| Koreans | 98.3 /100 | #64 | Exceptional 7.8% |
| Immigrants | Bulgaria | 98.3 /100 | #65 | Exceptional 7.8% |
| Dutch | 98.3 /100 | #66 | Exceptional 7.8% |
| Northern Europeans | 98.3 /100 | #67 | Exceptional 7.8% |
| Australians | 98.2 /100 | #68 | Exceptional 7.8% |
| Immigrants | Belgium | 98.2 /100 | #69 | Exceptional 7.8% |
| Immigrants | Canada | 98.2 /100 | #70 | Exceptional 7.8% |
| Cambodians | 98.2 /100 | #71 | Exceptional 7.8% |
| Immigrants | Romania | 98.2 /100 | #72 | Exceptional 7.8% |
| Austrians | 98.2 /100 | #73 | Exceptional 7.8% |
| Immigrants | China | 98.1 /100 | #74 | Exceptional 7.8% |
Demographics Similar to Immigrants from Jamaica by Family Poverty
In terms of family poverty, the demographic groups most similar to Immigrants from Jamaica are Immigrants from Bahamas (11.1%, a difference of 0.10%), Immigrants from Nicaragua (11.1%, a difference of 0.34%), Immigrants from Ecuador (11.1%, a difference of 0.35%), Somali (11.2%, a difference of 0.51%), and Spanish American (11.2%, a difference of 0.60%).
| Demographics | Rating | Rank | Family Poverty |
| Immigrants | Trinidad and Tobago | 0.1 /100 | #265 | Tragic 10.9% |
| Immigrants | El Salvador | 0.1 /100 | #266 | Tragic 11.0% |
| Comanche | 0.1 /100 | #267 | Tragic 11.0% |
| Jamaicans | 0.1 /100 | #268 | Tragic 11.1% |
| Immigrants | Ecuador | 0.1 /100 | #269 | Tragic 11.1% |
| Immigrants | Nicaragua | 0.1 /100 | #270 | Tragic 11.1% |
| Immigrants | Bahamas | 0.1 /100 | #271 | Tragic 11.1% |
| Immigrants | Jamaica | 0.1 /100 | #272 | Tragic 11.2% |
| Somalis | 0.1 /100 | #273 | Tragic 11.2% |
| Spanish Americans | 0.1 /100 | #274 | Tragic 11.2% |
| Central Americans | 0.1 /100 | #275 | Tragic 11.2% |
| Immigrants | Guyana | 0.1 /100 | #276 | Tragic 11.2% |
| Chippewa | 0.1 /100 | #277 | Tragic 11.2% |
| Guyanese | 0.1 /100 | #278 | Tragic 11.2% |
| Blackfeet | 0.0 /100 | #279 | Tragic 11.3% |