Asian vs Immigrants from Jamaica Family Poverty
COMPARE
Asian
Immigrants from Jamaica
Family Poverty
Family Poverty Comparison
Asians
Immigrants from Jamaica
7.7%
FAMILY POVERTY
98.7/ 100
METRIC RATING
57th/ 347
METRIC RANK
11.2%
FAMILY POVERTY
0.1/ 100
METRIC RATING
272nd/ 347
METRIC RANK
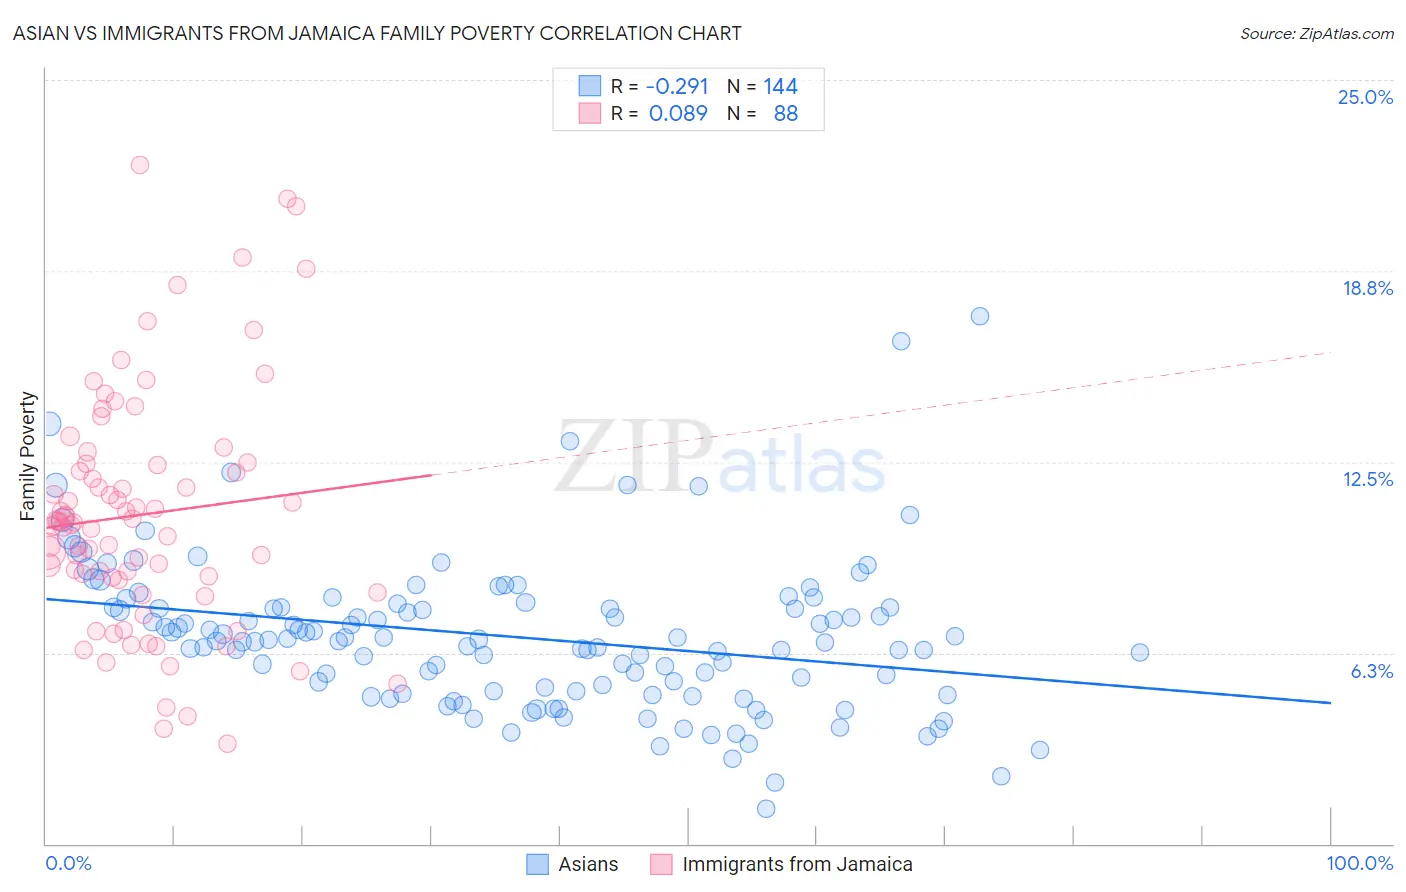
Asian vs Immigrants from Jamaica Family Poverty Correlation Chart
The statistical analysis conducted on geographies consisting of 547,164,240 people shows a weak negative correlation between the proportion of Asians and poverty level among families in the United States with a correlation coefficient (R) of -0.291 and weighted average of 7.7%. Similarly, the statistical analysis conducted on geographies consisting of 301,099,868 people shows a slight positive correlation between the proportion of Immigrants from Jamaica and poverty level among families in the United States with a correlation coefficient (R) of 0.089 and weighted average of 11.2%, a difference of 44.3%.
Family Poverty Correlation Summary
| Measurement | Asian | Immigrants from Jamaica |
| Minimum | 1.2% | 3.3% |
| Maximum | 17.3% | 22.2% |
| Range | 16.1% | 19.0% |
| Mean | 6.8% | 10.8% |
| Median | 6.7% | 10.5% |
| Interquartile 25% (IQ1) | 5.0% | 8.7% |
| Interquartile 75% (IQ3) | 7.7% | 12.4% |
| Interquartile Range (IQR) | 2.7% | 3.7% |
| Standard Deviation (Sample) | 2.5% | 3.9% |
| Standard Deviation (Population) | 2.5% | 3.9% |
Similar Demographics by Family Poverty
Demographics Similar to Asians by Family Poverty
In terms of family poverty, the demographic groups most similar to Asians are Finnish (7.7%, a difference of 0.030%), European (7.7%, a difference of 0.040%), Immigrants from Greece (7.7%, a difference of 0.050%), Immigrants from Serbia (7.7%, a difference of 0.090%), and Immigrants from Eastern Asia (7.7%, a difference of 0.13%).
| Demographics | Rating | Rank | Family Poverty |
| Immigrants | North Macedonia | 98.9 /100 | #50 | Exceptional 7.7% |
| Immigrants | Moldova | 98.8 /100 | #51 | Exceptional 7.7% |
| Indians (Asian) | 98.8 /100 | #52 | Exceptional 7.7% |
| Swiss | 98.8 /100 | #53 | Exceptional 7.7% |
| Immigrants | Sweden | 98.8 /100 | #54 | Exceptional 7.7% |
| Immigrants | Eastern Asia | 98.7 /100 | #55 | Exceptional 7.7% |
| Immigrants | Serbia | 98.7 /100 | #56 | Exceptional 7.7% |
| Asians | 98.7 /100 | #57 | Exceptional 7.7% |
| Finns | 98.7 /100 | #58 | Exceptional 7.7% |
| Europeans | 98.7 /100 | #59 | Exceptional 7.7% |
| Immigrants | Greece | 98.7 /100 | #60 | Exceptional 7.7% |
| Immigrants | Netherlands | 98.6 /100 | #61 | Exceptional 7.7% |
| Macedonians | 98.6 /100 | #62 | Exceptional 7.8% |
| Zimbabweans | 98.4 /100 | #63 | Exceptional 7.8% |
| Koreans | 98.3 /100 | #64 | Exceptional 7.8% |
Demographics Similar to Immigrants from Jamaica by Family Poverty
In terms of family poverty, the demographic groups most similar to Immigrants from Jamaica are Immigrants from Bahamas (11.1%, a difference of 0.10%), Immigrants from Nicaragua (11.1%, a difference of 0.34%), Immigrants from Ecuador (11.1%, a difference of 0.35%), Somali (11.2%, a difference of 0.51%), and Spanish American (11.2%, a difference of 0.60%).
| Demographics | Rating | Rank | Family Poverty |
| Immigrants | Trinidad and Tobago | 0.1 /100 | #265 | Tragic 10.9% |
| Immigrants | El Salvador | 0.1 /100 | #266 | Tragic 11.0% |
| Comanche | 0.1 /100 | #267 | Tragic 11.0% |
| Jamaicans | 0.1 /100 | #268 | Tragic 11.1% |
| Immigrants | Ecuador | 0.1 /100 | #269 | Tragic 11.1% |
| Immigrants | Nicaragua | 0.1 /100 | #270 | Tragic 11.1% |
| Immigrants | Bahamas | 0.1 /100 | #271 | Tragic 11.1% |
| Immigrants | Jamaica | 0.1 /100 | #272 | Tragic 11.2% |
| Somalis | 0.1 /100 | #273 | Tragic 11.2% |
| Spanish Americans | 0.1 /100 | #274 | Tragic 11.2% |
| Central Americans | 0.1 /100 | #275 | Tragic 11.2% |
| Immigrants | Guyana | 0.1 /100 | #276 | Tragic 11.2% |
| Chippewa | 0.1 /100 | #277 | Tragic 11.2% |
| Guyanese | 0.1 /100 | #278 | Tragic 11.2% |
| Blackfeet | 0.0 /100 | #279 | Tragic 11.3% |