Northern European vs Immigrants from Guatemala Family Poverty

COMPARE

Northern European
Race
Ancestry
AfghanAfricanAlaska NativeAlaskan AthabascanAlbanianAleutAlsatianAmericanApacheArabArapahoArgentineanArmenianAssyrian/Chaldean/SyriacAustralianAustrianBahamianBangladeshiBarbadianBasqueBelgianBelizeanBermudanBhutaneseBlackfeetBolivianBrazilianBritishBritish West IndianBulgarianBurmeseCajunCambodianCanadianCape VerdeanCarpatho RusynCelticCentral AmericanCentral American IndianCherokeeCheyenneChickasawChileanChineseChippewaChoctawColombianColvilleComancheCosta RicanCreeCreekCroatianCrowCubanCypriotCzechCzechoslovakianDanishDelawareDominicanDutchDutch West IndianEastern EuropeanEcuadorianEgyptianEnglishEstonianEthiopianEuropeanFijianFilipinoFinnishFrenchFrench American IndianFrench CanadianGermanGerman RussianGhanaianGreekGuamanian/ChamorroGuatemalanGuyaneseHaitianHmongHonduranHopiHoumaHungarianIcelanderIndian (Asian)IndonesianInupiatIranianIraqiIrishIroquoisIsraeliItalianJamaicanJapaneseJordanianKenyanKiowaKoreanLaotianLatvianLebaneseLiberianLithuanianLumbeeLuxembourgerMacedonianMalaysianMalteseMarshalleseMenomineeMexicanMexican American IndianMongolianMoroccanNative HawaiianNavajoNepaleseNew ZealanderNicaraguanNigerianNorthern EuropeanNorwegianOkinawanOsageOttawaPaiutePakistaniPalestinianPanamanianParaguayanPennsylvania GermanPeruvianPimaPolishPortuguesePotawatomiPuebloPuerto RicanPuget Sound SalishRomanianRussianSalvadoranSamoanScandinavianScotch-IrishScottishSeminoleSenegaleseSerbianShoshoneSierra LeoneanSiouxSlavicSlovakSloveneSomaliSouth AfricanSouth AmericanSouth American IndianSoviet UnionSpaniardSpanishSpanish AmericanSpanish American IndianSri LankanSubsaharan AfricanSudaneseSwedishSwissSyrianTaiwaneseThaiTlingit-HaidaTohono O'OdhamTonganTrinidadian and TobagonianTsimshianTurkishU.S. Virgin IslanderUgandanUkrainianUruguayanUteVenezuelanVietnameseWelshWest IndianYakamaYaquiYugoslavianYumanYup'ikZimbabwean
Immigration
NonimmigrantsImmigrantsAfghanistanAfricaAlbaniaArgentinaArmeniaAsiaAustraliaAustriaBahamasBangladeshBarbadosBelarusBelgiumBelizeBoliviaBosnia and HerzegovinaBrazilBulgariaBurma/MyanmarCabo VerdeCambodiaCameroonCanadaCaribbeanCentral AmericaChileChinaColombiaCongoCosta RicaCroatiaCubaCzechoslovakiaDenmarkDominicaDominican RepublicEastern AfricaEastern AsiaEastern EuropeEcuadorEgyptEl SalvadorEnglandEritreaEthiopiaEuropeFijiFranceGermanyGhanaGreeceGrenadaGuyanaHaitiHondurasHong KongHungaryIndiaIndonesiaIranIraqIrelandIsraelItalyJamaicaJapanJordanKazakhstanKenyaKoreaKuwaitLaosLatin AmericaLatviaLebanonLiberiaLithuaniaMalaysiaMexicoMicronesiaMiddle AfricaMoldovaMoroccoNepalNetherlandsNicaraguaNigeriaNorth AmericaNorth MacedoniaNorthern AfricaNorthern EuropeNorwayOceaniaPakistanPanamaPeruPhilippinesPolandPortugalRomaniaRussiaSaudi ArabiaScotlandSenegalSerbiaSierra LeoneSingaporeSomaliaSouth AfricaSouth AmericaSouth Central AsiaSouth Eastern AsiaSouthern EuropeSpainSri LankaSt. Vincent and the GrenadinesSudanSwedenSwitzerlandSyriaTaiwanThailandTrinidad and TobagoTurkeyUgandaUkraineUruguayUzbekistanVenezuelaVietnamWest IndiesWestern AfricaWestern AsiaWestern EuropeYemenZaireZimbabweAzores
Immigrants from Guatemala
Race
Ancestry
AfghanAfricanAlaska NativeAlaskan AthabascanAlbanianAleutAlsatianAmericanApacheArabArapahoArgentineanArmenianAssyrian/Chaldean/SyriacAustralianAustrianBahamianBangladeshiBarbadianBasqueBelgianBelizeanBermudanBhutaneseBlackfeetBolivianBrazilianBritishBritish West IndianBulgarianBurmeseCajunCambodianCanadianCape VerdeanCarpatho RusynCelticCentral AmericanCentral American IndianCherokeeCheyenneChickasawChileanChineseChippewaChoctawColombianColvilleComancheCosta RicanCreeCreekCroatianCrowCubanCypriotCzechCzechoslovakianDanishDelawareDominicanDutchDutch West IndianEastern EuropeanEcuadorianEgyptianEnglishEstonianEthiopianEuropeanFijianFilipinoFinnishFrenchFrench American IndianFrench CanadianGermanGerman RussianGhanaianGreekGuamanian/ChamorroGuatemalanGuyaneseHaitianHmongHonduranHopiHoumaHungarianIcelanderIndian (Asian)IndonesianInupiatIranianIraqiIrishIroquoisIsraeliItalianJamaicanJapaneseJordanianKenyanKiowaKoreanLaotianLatvianLebaneseLiberianLithuanianLumbeeLuxembourgerMacedonianMalaysianMalteseMarshalleseMenomineeMexicanMexican American IndianMongolianMoroccanNative HawaiianNavajoNepaleseNew ZealanderNicaraguanNigerianNorwegianOkinawanOsageOttawaPaiutePakistaniPalestinianPanamanianParaguayanPennsylvania GermanPeruvianPimaPolishPortuguesePotawatomiPuebloPuerto RicanPuget Sound SalishRomanianRussianSalvadoranSamoanScandinavianScotch-IrishScottishSeminoleSenegaleseSerbianShoshoneSierra LeoneanSiouxSlavicSlovakSloveneSomaliSouth AfricanSouth AmericanSouth American IndianSoviet UnionSpaniardSpanishSpanish AmericanSpanish American IndianSri LankanSubsaharan AfricanSudaneseSwedishSwissSyrianTaiwaneseThaiTlingit-HaidaTohono O'OdhamTonganTrinidadian and TobagonianTsimshianTurkishU.S. Virgin IslanderUgandanUkrainianUruguayanUteVenezuelanVietnameseWelshWest IndianYakamaYaquiYugoslavianYumanYup'ikZimbabwean
Immigration
NonimmigrantsImmigrantsAfghanistanAfricaAlbaniaArgentinaArmeniaAsiaAustraliaAustriaBahamasBangladeshBarbadosBelarusBelgiumBelizeBoliviaBosnia and HerzegovinaBrazilBulgariaBurma/MyanmarCabo VerdeCambodiaCameroonCanadaCaribbeanCentral AmericaChileChinaColombiaCongoCosta RicaCroatiaCubaCzechoslovakiaDenmarkDominicaDominican RepublicEastern AfricaEastern AsiaEastern EuropeEcuadorEgyptEl SalvadorEnglandEritreaEthiopiaEuropeFijiFranceGermanyGhanaGreeceGrenadaGuatemalaGuyanaHaitiHondurasHong KongHungaryIndiaIndonesiaIranIraqIrelandIsraelItalyJamaicaJapanJordanKazakhstanKenyaKoreaKuwaitLaosLatin AmericaLatviaLebanonLiberiaLithuaniaMalaysiaMexicoMicronesiaMiddle AfricaMoldovaMoroccoNepalNetherlandsNicaraguaNigeriaNorth AmericaNorth MacedoniaNorthern AfricaNorthern EuropeNorwayOceaniaPakistanPanamaPeruPhilippinesPolandPortugalRomaniaRussiaSaudi ArabiaScotlandSenegalSerbiaSierra LeoneSingaporeSomaliaSouth AfricaSouth AmericaSouth Central AsiaSouth Eastern AsiaSouthern EuropeSpainSri LankaSt. Vincent and the GrenadinesSudanSwedenSwitzerlandSyriaTaiwanThailandTrinidad and TobagoTurkeyUgandaUkraineUruguayUzbekistanVenezuelaVietnamWest IndiesWestern AfricaWestern AsiaWestern EuropeYemenZaireZimbabweAzores
Family Poverty
Income
Poverty
Unemployment
Labor Participation
Family Structure
Vehicle Availability
Education Level
Disability

Family Poverty Comparison

Northern Europeans

Immigrants from Guatemala

Exceptional
Tragic
7.8%
FAMILY POVERTY
98.3/ 100
METRIC RATING
67th/ 347
METRIC RANK
12.0%
FAMILY POVERTY
0.0/ 100
METRIC RATING
310th/ 347
METRIC RANK

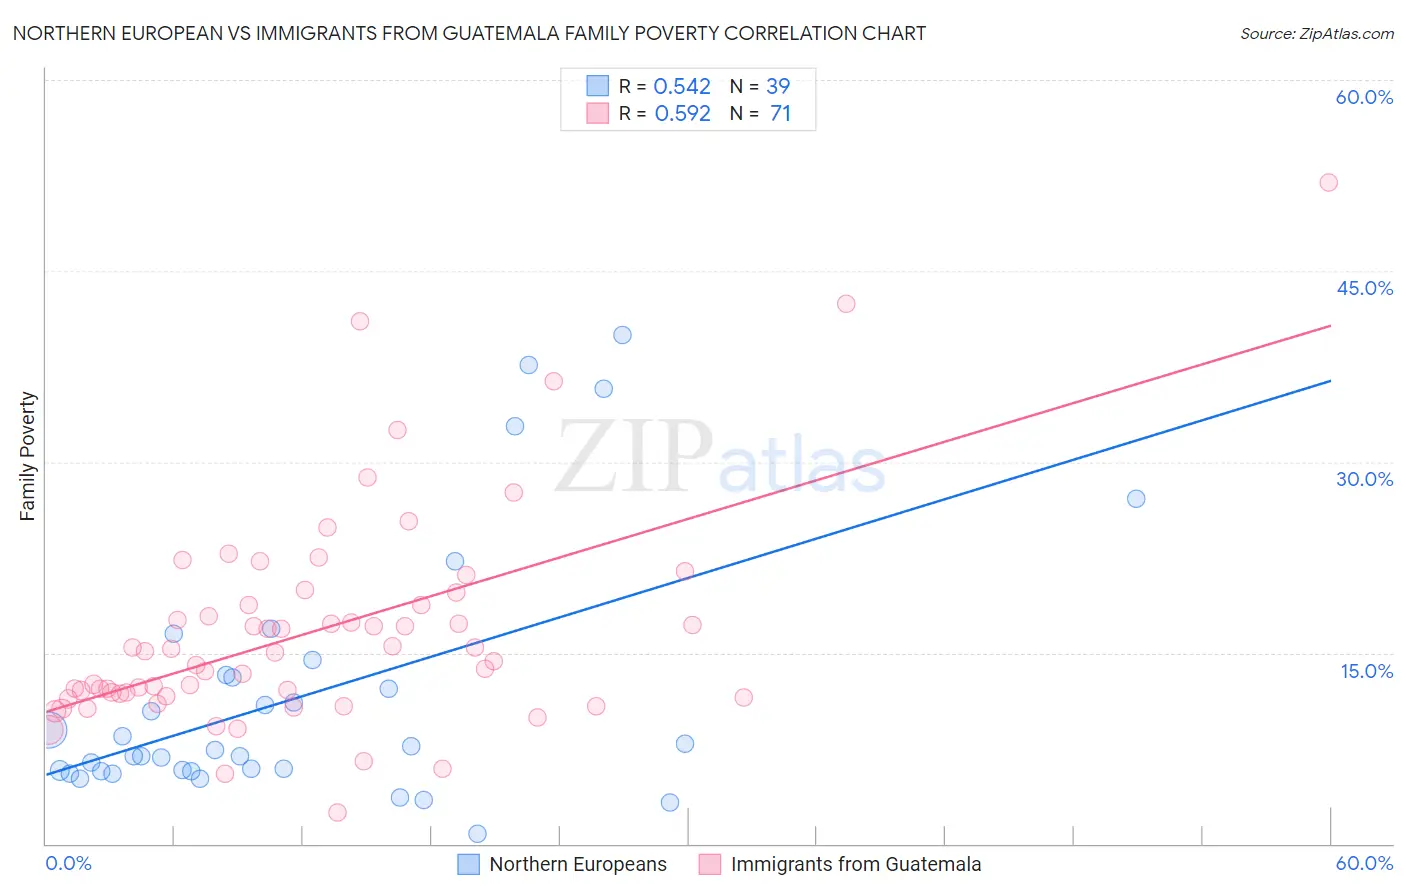
Northern European vs Immigrants from Guatemala Family Poverty Correlation Chart

The statistical analysis conducted on geographies consisting of 404,830,056 people shows a substantial positive correlation between the proportion of Northern Europeans and poverty level among families in the United States with a correlation coefficient (R) of 0.542 and weighted average of 7.8%. Similarly, the statistical analysis conducted on geographies consisting of 376,740,160 people shows a substantial positive correlation between the proportion of Immigrants from Guatemala and poverty level among families in the United States with a correlation coefficient (R) of 0.592 and weighted average of 12.0%, a difference of 53.0%.
Northern European vs Immigrants from Guatemala Family Poverty

Family Poverty Correlation Summary

MeasurementNorthern EuropeanImmigrants from Guatemala
Minimum0.78%2.5%
Maximum40.0%51.9%
Range39.2%49.4%
Mean11.7%16.7%
Median7.4%15.1%
Interquartile 25% (IQ1)5.7%11.6%
Interquartile 75% (IQ3)13.2%18.8%
Interquartile Range (IQR)7.5%7.2%
Standard Deviation (Sample)10.0%8.6%
Standard Deviation (Population)9.9%8.5%

Similar Demographics by Family Poverty

Demographics Similar to Northern Europeans by Family Poverty

In terms of family poverty, the demographic groups most similar to Northern Europeans are Dutch (7.8%, a difference of 0.010%), Australian (7.8%, a difference of 0.030%), Immigrants from Belgium (7.8%, a difference of 0.050%), Immigrants from Bulgaria (7.8%, a difference of 0.070%), and Korean (7.8%, a difference of 0.080%).
DemographicsRating | RankFamily Poverty
Immigrants | Greece
98.7
/100
|
#60
Exceptional
7.7%
Immigrants | Netherlands
98.6
/100
|
#61
Exceptional
7.7%
Macedonians
98.6
/100
|
#62
Exceptional
7.8%
Zimbabweans
98.4
/100
|
#63
Exceptional
7.8%
Koreans
98.3
/100
|
#64
Exceptional
7.8%
Immigrants | Bulgaria
98.3
/100
|
#65
Exceptional
7.8%
Dutch
98.3
/100
|
#66
Exceptional
7.8%
Northern Europeans
98.3
/100
|
#67
Exceptional
7.8%
Australians
98.2
/100
|
#68
Exceptional
7.8%
Immigrants | Belgium
98.2
/100
|
#69
Exceptional
7.8%
Immigrants | Canada
98.2
/100
|
#70
Exceptional
7.8%
Cambodians
98.2
/100
|
#71
Exceptional
7.8%
Immigrants | Romania
98.2
/100
|
#72
Exceptional
7.8%
Austrians
98.2
/100
|
#73
Exceptional
7.8%
Immigrants | China
98.1
/100
|
#74
Exceptional
7.8%

Demographics Similar to Immigrants from Guatemala by Family Poverty

In terms of family poverty, the demographic groups most similar to Immigrants from Guatemala are Hispanic or Latino (12.0%, a difference of 0.0%), Seminole (11.9%, a difference of 0.45%), Immigrants from Congo (11.9%, a difference of 0.51%), Cajun (11.9%, a difference of 0.62%), and Ute (12.1%, a difference of 0.84%).
DemographicsRating | RankFamily Poverty
Africans
0.0
/100
|
#303
Tragic
11.8%
Immigrants | Latin America
0.0
/100
|
#304
Tragic
11.8%
Mexicans
0.0
/100
|
#305
Tragic
11.8%
Cajuns
0.0
/100
|
#306
Tragic
11.9%
Immigrants | Congo
0.0
/100
|
#307
Tragic
11.9%
Seminole
0.0
/100
|
#308
Tragic
11.9%
Hispanics or Latinos
0.0
/100
|
#309
Tragic
12.0%
Immigrants | Guatemala
0.0
/100
|
#310
Tragic
12.0%
Ute
0.0
/100
|
#311
Tragic
12.1%
Immigrants | Central America
0.0
/100
|
#312
Tragic
12.1%
Immigrants | Caribbean
0.0
/100
|
#313
Tragic
12.2%
Kiowa
0.0
/100
|
#314
Tragic
12.2%
Immigrants | Mexico
0.0
/100
|
#315
Tragic
12.3%
Hondurans
0.0
/100
|
#316
Tragic
12.4%
Immigrants | Grenada
0.0
/100
|
#317
Tragic
12.4%