Northern European vs Armenian Family Poverty
COMPARE
Northern European
Armenian
Family Poverty
Family Poverty Comparison
Northern Europeans
Armenians
7.8%
FAMILY POVERTY
98.3/ 100
METRIC RATING
67th/ 347
METRIC RANK
8.5%
FAMILY POVERTY
84.6/ 100
METRIC RATING
138th/ 347
METRIC RANK
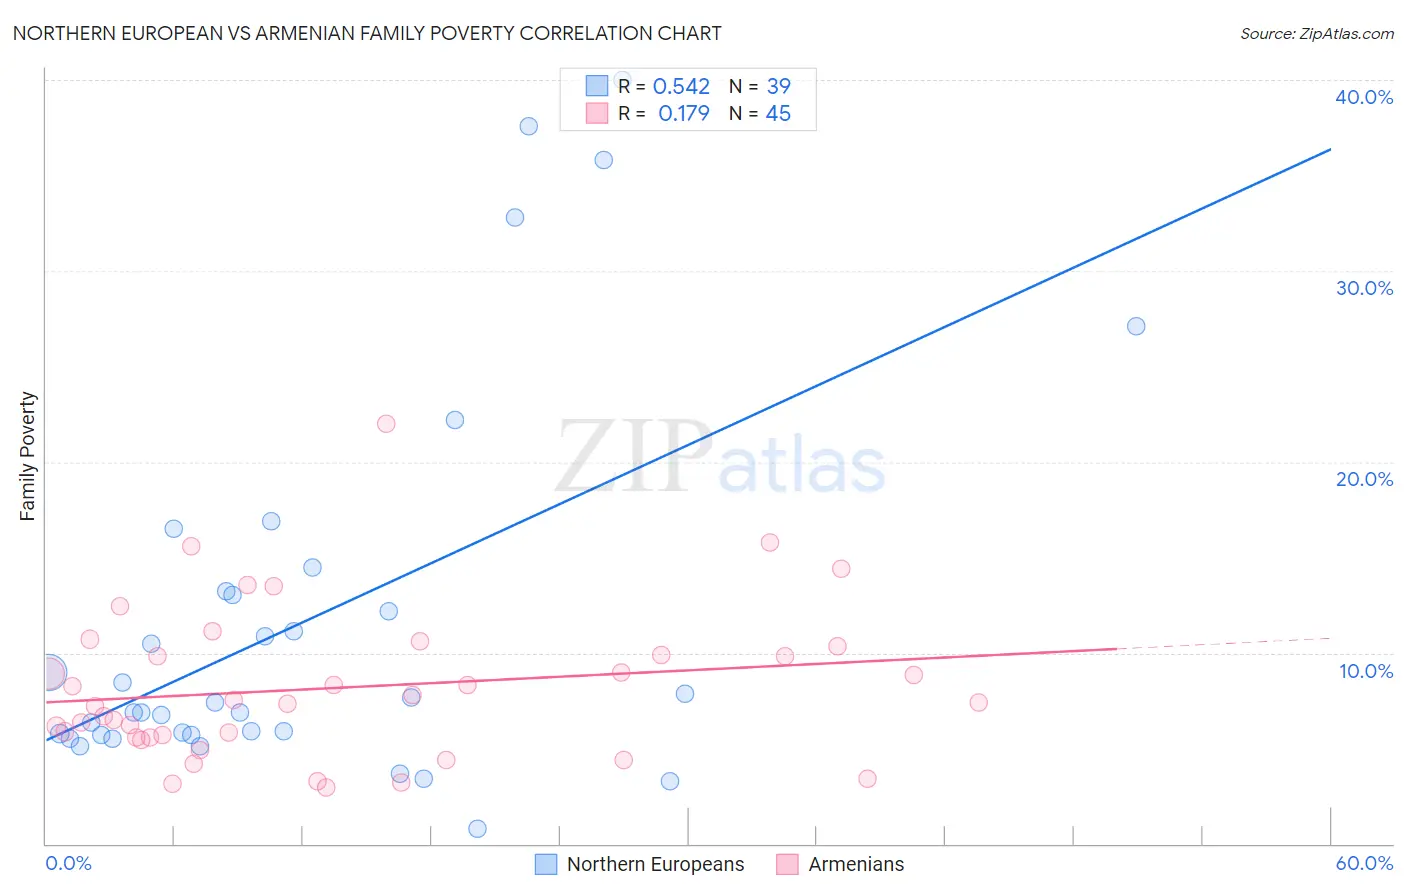
Northern European vs Armenian Family Poverty Correlation Chart
The statistical analysis conducted on geographies consisting of 404,830,056 people shows a substantial positive correlation between the proportion of Northern Europeans and poverty level among families in the United States with a correlation coefficient (R) of 0.542 and weighted average of 7.8%. Similarly, the statistical analysis conducted on geographies consisting of 310,074,733 people shows a poor positive correlation between the proportion of Armenians and poverty level among families in the United States with a correlation coefficient (R) of 0.179 and weighted average of 8.5%, a difference of 8.8%.
Family Poverty Correlation Summary
| Measurement | Northern European | Armenian |
| Minimum | 0.78% | 3.0% |
| Maximum | 40.0% | 22.0% |
| Range | 39.2% | 19.0% |
| Mean | 11.7% | 8.2% |
| Median | 7.4% | 7.4% |
| Interquartile 25% (IQ1) | 5.7% | 5.6% |
| Interquartile 75% (IQ3) | 13.2% | 10.1% |
| Interquartile Range (IQR) | 7.5% | 4.5% |
| Standard Deviation (Sample) | 10.0% | 4.0% |
| Standard Deviation (Population) | 9.9% | 3.9% |
Similar Demographics by Family Poverty
Demographics Similar to Northern Europeans by Family Poverty
In terms of family poverty, the demographic groups most similar to Northern Europeans are Dutch (7.8%, a difference of 0.010%), Australian (7.8%, a difference of 0.030%), Immigrants from Belgium (7.8%, a difference of 0.050%), Immigrants from Bulgaria (7.8%, a difference of 0.070%), and Korean (7.8%, a difference of 0.080%).
| Demographics | Rating | Rank | Family Poverty |
| Immigrants | Greece | 98.7 /100 | #60 | Exceptional 7.7% |
| Immigrants | Netherlands | 98.6 /100 | #61 | Exceptional 7.7% |
| Macedonians | 98.6 /100 | #62 | Exceptional 7.8% |
| Zimbabweans | 98.4 /100 | #63 | Exceptional 7.8% |
| Koreans | 98.3 /100 | #64 | Exceptional 7.8% |
| Immigrants | Bulgaria | 98.3 /100 | #65 | Exceptional 7.8% |
| Dutch | 98.3 /100 | #66 | Exceptional 7.8% |
| Northern Europeans | 98.3 /100 | #67 | Exceptional 7.8% |
| Australians | 98.2 /100 | #68 | Exceptional 7.8% |
| Immigrants | Belgium | 98.2 /100 | #69 | Exceptional 7.8% |
| Immigrants | Canada | 98.2 /100 | #70 | Exceptional 7.8% |
| Cambodians | 98.2 /100 | #71 | Exceptional 7.8% |
| Immigrants | Romania | 98.2 /100 | #72 | Exceptional 7.8% |
| Austrians | 98.2 /100 | #73 | Exceptional 7.8% |
| Immigrants | China | 98.1 /100 | #74 | Exceptional 7.8% |
Demographics Similar to Armenians by Family Poverty
In terms of family poverty, the demographic groups most similar to Armenians are Immigrants from Nepal (8.5%, a difference of 0.12%), Immigrants from Kazakhstan (8.5%, a difference of 0.15%), Immigrants from Ukraine (8.5%, a difference of 0.18%), Yugoslavian (8.5%, a difference of 0.30%), and Immigrants from Germany (8.5%, a difference of 0.33%).
| Demographics | Rating | Rank | Family Poverty |
| Puget Sound Salish | 88.6 /100 | #131 | Excellent 8.4% |
| Immigrants | Argentina | 88.2 /100 | #132 | Excellent 8.4% |
| Sri Lankans | 86.6 /100 | #133 | Excellent 8.5% |
| Chileans | 86.6 /100 | #134 | Excellent 8.5% |
| Immigrants | Malaysia | 86.5 /100 | #135 | Excellent 8.5% |
| Immigrants | Brazil | 86.3 /100 | #136 | Excellent 8.5% |
| Immigrants | Southern Europe | 86.0 /100 | #137 | Excellent 8.5% |
| Armenians | 84.6 /100 | #138 | Excellent 8.5% |
| Immigrants | Nepal | 84.2 /100 | #139 | Excellent 8.5% |
| Immigrants | Kazakhstan | 84.1 /100 | #140 | Excellent 8.5% |
| Immigrants | Ukraine | 83.9 /100 | #141 | Excellent 8.5% |
| Yugoslavians | 83.5 /100 | #142 | Excellent 8.5% |
| Immigrants | Germany | 83.3 /100 | #143 | Excellent 8.5% |
| Albanians | 83.3 /100 | #144 | Excellent 8.5% |
| Immigrants | South Eastern Asia | 83.2 /100 | #145 | Excellent 8.5% |