Immigrants from Hungary vs Immigrants from Jamaica Family Poverty
COMPARE
Immigrants from Hungary
Immigrants from Jamaica
Family Poverty
Family Poverty Comparison
Immigrants from Hungary
Immigrants from Jamaica
8.4%
FAMILY POVERTY
89.9/ 100
METRIC RATING
127th/ 347
METRIC RANK
11.2%
FAMILY POVERTY
0.1/ 100
METRIC RATING
272nd/ 347
METRIC RANK
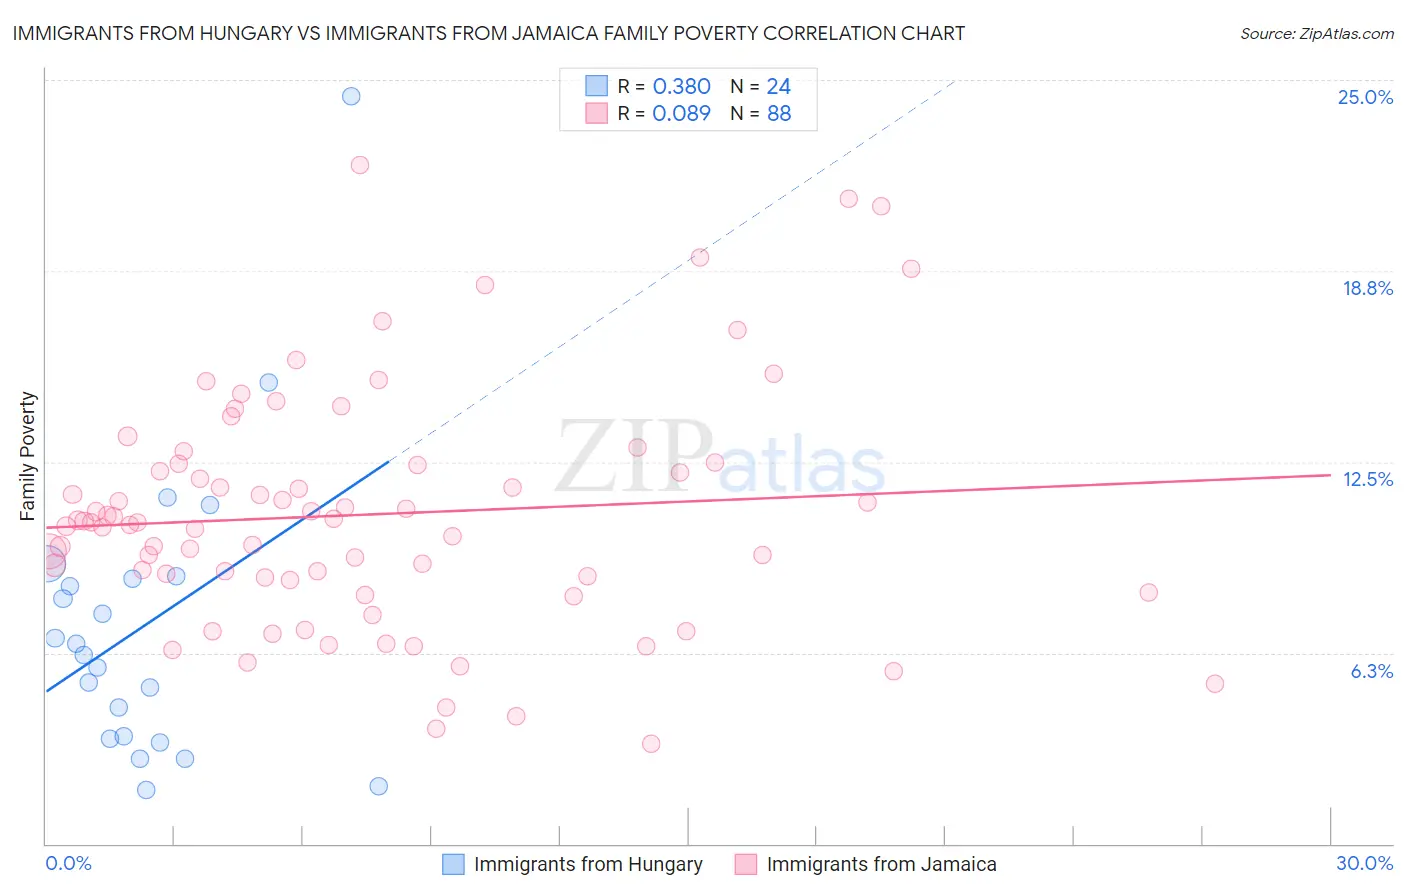
Immigrants from Hungary vs Immigrants from Jamaica Family Poverty Correlation Chart
The statistical analysis conducted on geographies consisting of 195,433,579 people shows a mild positive correlation between the proportion of Immigrants from Hungary and poverty level among families in the United States with a correlation coefficient (R) of 0.380 and weighted average of 8.4%. Similarly, the statistical analysis conducted on geographies consisting of 301,099,868 people shows a slight positive correlation between the proportion of Immigrants from Jamaica and poverty level among families in the United States with a correlation coefficient (R) of 0.089 and weighted average of 11.2%, a difference of 33.4%.
Family Poverty Correlation Summary
| Measurement | Immigrants from Hungary | Immigrants from Jamaica |
| Minimum | 1.8% | 3.3% |
| Maximum | 24.5% | 22.2% |
| Range | 22.7% | 19.0% |
| Mean | 7.2% | 10.8% |
| Median | 6.4% | 10.5% |
| Interquartile 25% (IQ1) | 3.5% | 8.7% |
| Interquartile 75% (IQ3) | 8.7% | 12.4% |
| Interquartile Range (IQR) | 5.2% | 3.7% |
| Standard Deviation (Sample) | 4.9% | 3.9% |
| Standard Deviation (Population) | 4.8% | 3.9% |
Similar Demographics by Family Poverty
Demographics Similar to Immigrants from Hungary by Family Poverty
In terms of family poverty, the demographic groups most similar to Immigrants from Hungary are Icelander (8.3%, a difference of 0.13%), Argentinean (8.4%, a difference of 0.14%), Portuguese (8.4%, a difference of 0.30%), Pakistani (8.3%, a difference of 0.33%), and Soviet Union (8.3%, a difference of 0.37%).
| Demographics | Rating | Rank | Family Poverty |
| Immigrants | Egypt | 91.6 /100 | #120 | Exceptional 8.3% |
| Native Hawaiians | 91.3 /100 | #121 | Exceptional 8.3% |
| Paraguayans | 91.2 /100 | #122 | Exceptional 8.3% |
| Palestinians | 91.1 /100 | #123 | Exceptional 8.3% |
| Soviet Union | 90.8 /100 | #124 | Exceptional 8.3% |
| Pakistanis | 90.8 /100 | #125 | Exceptional 8.3% |
| Icelanders | 90.3 /100 | #126 | Exceptional 8.3% |
| Immigrants | Hungary | 89.9 /100 | #127 | Excellent 8.4% |
| Argentineans | 89.6 /100 | #128 | Excellent 8.4% |
| Portuguese | 89.2 /100 | #129 | Excellent 8.4% |
| Immigrants | Bosnia and Herzegovina | 88.6 /100 | #130 | Excellent 8.4% |
| Puget Sound Salish | 88.6 /100 | #131 | Excellent 8.4% |
| Immigrants | Argentina | 88.2 /100 | #132 | Excellent 8.4% |
| Sri Lankans | 86.6 /100 | #133 | Excellent 8.5% |
| Chileans | 86.6 /100 | #134 | Excellent 8.5% |
Demographics Similar to Immigrants from Jamaica by Family Poverty
In terms of family poverty, the demographic groups most similar to Immigrants from Jamaica are Immigrants from Bahamas (11.1%, a difference of 0.10%), Immigrants from Nicaragua (11.1%, a difference of 0.34%), Immigrants from Ecuador (11.1%, a difference of 0.35%), Somali (11.2%, a difference of 0.51%), and Spanish American (11.2%, a difference of 0.60%).
| Demographics | Rating | Rank | Family Poverty |
| Immigrants | Trinidad and Tobago | 0.1 /100 | #265 | Tragic 10.9% |
| Immigrants | El Salvador | 0.1 /100 | #266 | Tragic 11.0% |
| Comanche | 0.1 /100 | #267 | Tragic 11.0% |
| Jamaicans | 0.1 /100 | #268 | Tragic 11.1% |
| Immigrants | Ecuador | 0.1 /100 | #269 | Tragic 11.1% |
| Immigrants | Nicaragua | 0.1 /100 | #270 | Tragic 11.1% |
| Immigrants | Bahamas | 0.1 /100 | #271 | Tragic 11.1% |
| Immigrants | Jamaica | 0.1 /100 | #272 | Tragic 11.2% |
| Somalis | 0.1 /100 | #273 | Tragic 11.2% |
| Spanish Americans | 0.1 /100 | #274 | Tragic 11.2% |
| Central Americans | 0.1 /100 | #275 | Tragic 11.2% |
| Immigrants | Guyana | 0.1 /100 | #276 | Tragic 11.2% |
| Chippewa | 0.1 /100 | #277 | Tragic 11.2% |
| Guyanese | 0.1 /100 | #278 | Tragic 11.2% |
| Blackfeet | 0.0 /100 | #279 | Tragic 11.3% |