Northern European vs Immigrants from Egypt Family Poverty
COMPARE
Northern European
Immigrants from Egypt
Family Poverty
Family Poverty Comparison
Northern Europeans
Immigrants from Egypt
7.8%
FAMILY POVERTY
98.3/ 100
METRIC RATING
67th/ 347
METRIC RANK
8.3%
FAMILY POVERTY
91.6/ 100
METRIC RATING
120th/ 347
METRIC RANK
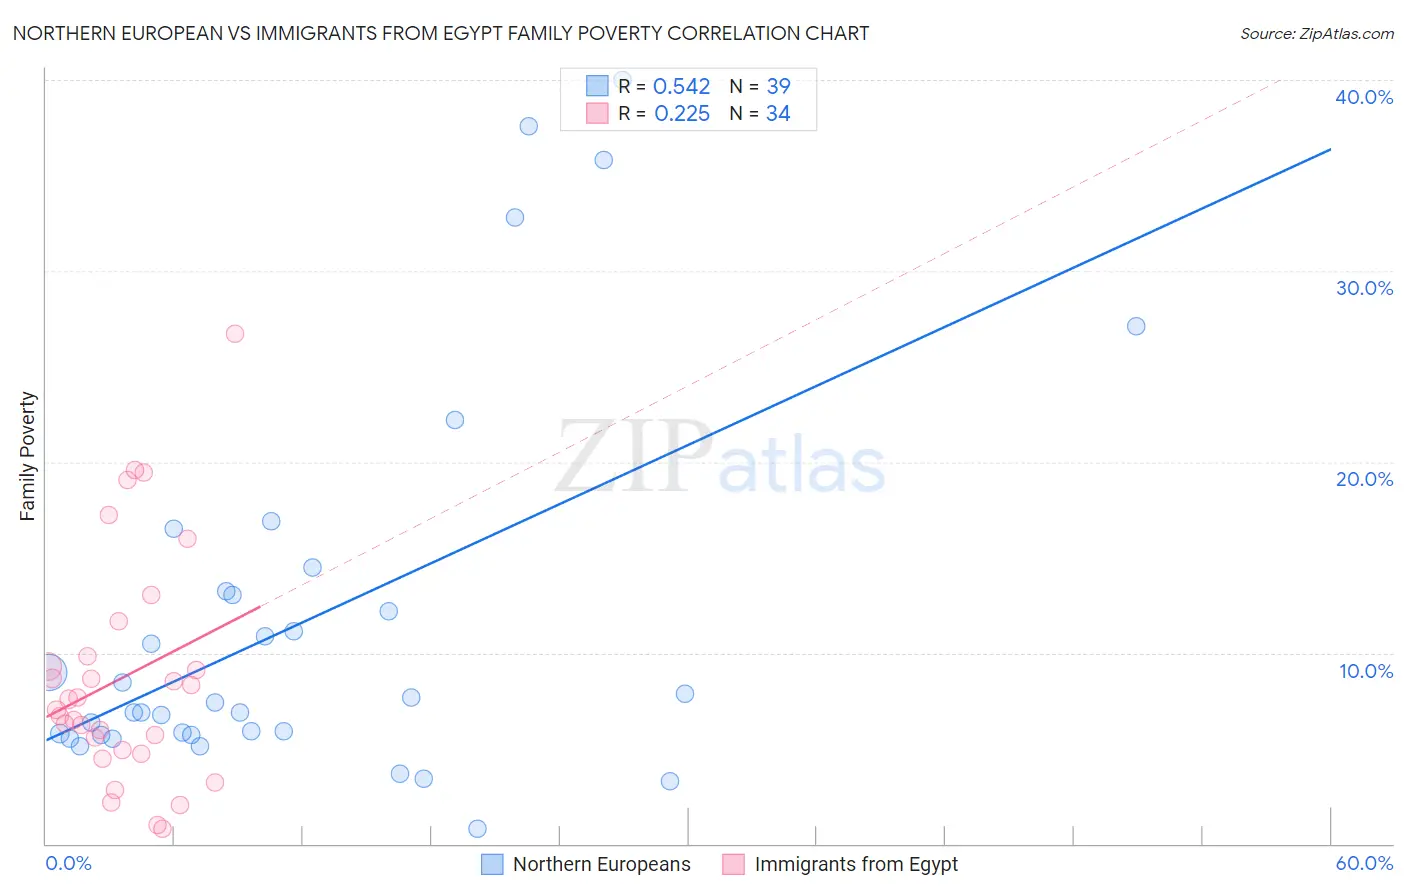
Northern European vs Immigrants from Egypt Family Poverty Correlation Chart
The statistical analysis conducted on geographies consisting of 404,830,056 people shows a substantial positive correlation between the proportion of Northern Europeans and poverty level among families in the United States with a correlation coefficient (R) of 0.542 and weighted average of 7.8%. Similarly, the statistical analysis conducted on geographies consisting of 245,176,811 people shows a weak positive correlation between the proportion of Immigrants from Egypt and poverty level among families in the United States with a correlation coefficient (R) of 0.225 and weighted average of 8.3%, a difference of 6.2%.
Family Poverty Correlation Summary
| Measurement | Northern European | Immigrants from Egypt |
| Minimum | 0.78% | 0.80% |
| Maximum | 40.0% | 26.7% |
| Range | 39.2% | 25.9% |
| Mean | 11.7% | 8.7% |
| Median | 7.4% | 7.3% |
| Interquartile 25% (IQ1) | 5.7% | 4.9% |
| Interquartile 75% (IQ3) | 13.2% | 9.8% |
| Interquartile Range (IQR) | 7.5% | 4.9% |
| Standard Deviation (Sample) | 10.0% | 6.0% |
| Standard Deviation (Population) | 9.9% | 5.9% |
Similar Demographics by Family Poverty
Demographics Similar to Northern Europeans by Family Poverty
In terms of family poverty, the demographic groups most similar to Northern Europeans are Dutch (7.8%, a difference of 0.010%), Australian (7.8%, a difference of 0.030%), Immigrants from Belgium (7.8%, a difference of 0.050%), Immigrants from Bulgaria (7.8%, a difference of 0.070%), and Korean (7.8%, a difference of 0.080%).
| Demographics | Rating | Rank | Family Poverty |
| Immigrants | Greece | 98.7 /100 | #60 | Exceptional 7.7% |
| Immigrants | Netherlands | 98.6 /100 | #61 | Exceptional 7.7% |
| Macedonians | 98.6 /100 | #62 | Exceptional 7.8% |
| Zimbabweans | 98.4 /100 | #63 | Exceptional 7.8% |
| Koreans | 98.3 /100 | #64 | Exceptional 7.8% |
| Immigrants | Bulgaria | 98.3 /100 | #65 | Exceptional 7.8% |
| Dutch | 98.3 /100 | #66 | Exceptional 7.8% |
| Northern Europeans | 98.3 /100 | #67 | Exceptional 7.8% |
| Australians | 98.2 /100 | #68 | Exceptional 7.8% |
| Immigrants | Belgium | 98.2 /100 | #69 | Exceptional 7.8% |
| Immigrants | Canada | 98.2 /100 | #70 | Exceptional 7.8% |
| Cambodians | 98.2 /100 | #71 | Exceptional 7.8% |
| Immigrants | Romania | 98.2 /100 | #72 | Exceptional 7.8% |
| Austrians | 98.2 /100 | #73 | Exceptional 7.8% |
| Immigrants | China | 98.1 /100 | #74 | Exceptional 7.8% |
Demographics Similar to Immigrants from Egypt by Family Poverty
In terms of family poverty, the demographic groups most similar to Immigrants from Egypt are Native Hawaiian (8.3%, a difference of 0.17%), Paraguayan (8.3%, a difference of 0.18%), Palestinian (8.3%, a difference of 0.25%), Soviet Union (8.3%, a difference of 0.35%), and Pakistani (8.3%, a difference of 0.39%).
| Demographics | Rating | Rank | Family Poverty |
| Canadians | 94.2 /100 | #113 | Exceptional 8.2% |
| Immigrants | Zimbabwe | 94.0 /100 | #114 | Exceptional 8.2% |
| Immigrants | Israel | 93.5 /100 | #115 | Exceptional 8.2% |
| South Africans | 93.4 /100 | #116 | Exceptional 8.2% |
| Immigrants | Russia | 93.2 /100 | #117 | Exceptional 8.2% |
| Immigrants | Western Europe | 92.9 /100 | #118 | Exceptional 8.2% |
| French | 92.8 /100 | #119 | Exceptional 8.3% |
| Immigrants | Egypt | 91.6 /100 | #120 | Exceptional 8.3% |
| Native Hawaiians | 91.3 /100 | #121 | Exceptional 8.3% |
| Paraguayans | 91.2 /100 | #122 | Exceptional 8.3% |
| Palestinians | 91.1 /100 | #123 | Exceptional 8.3% |
| Soviet Union | 90.8 /100 | #124 | Exceptional 8.3% |
| Pakistanis | 90.8 /100 | #125 | Exceptional 8.3% |
| Icelanders | 90.3 /100 | #126 | Exceptional 8.3% |
| Immigrants | Hungary | 89.9 /100 | #127 | Excellent 8.4% |