Northern European vs Immigrants from Italy Householder Income Ages 45 - 64 years
COMPARE
Northern European
Immigrants from Italy
Householder Income Ages 45 - 64 years
Householder Income Ages 45 - 64 years Comparison
Northern Europeans
Immigrants from Italy
$107,870
HOUSEHOLDER INCOME AGES 45 - 64 YEARS
97.8/ 100
METRIC RATING
97th/ 347
METRIC RANK
$110,434
HOUSEHOLDER INCOME AGES 45 - 64 YEARS
99.4/ 100
METRIC RATING
69th/ 347
METRIC RANK
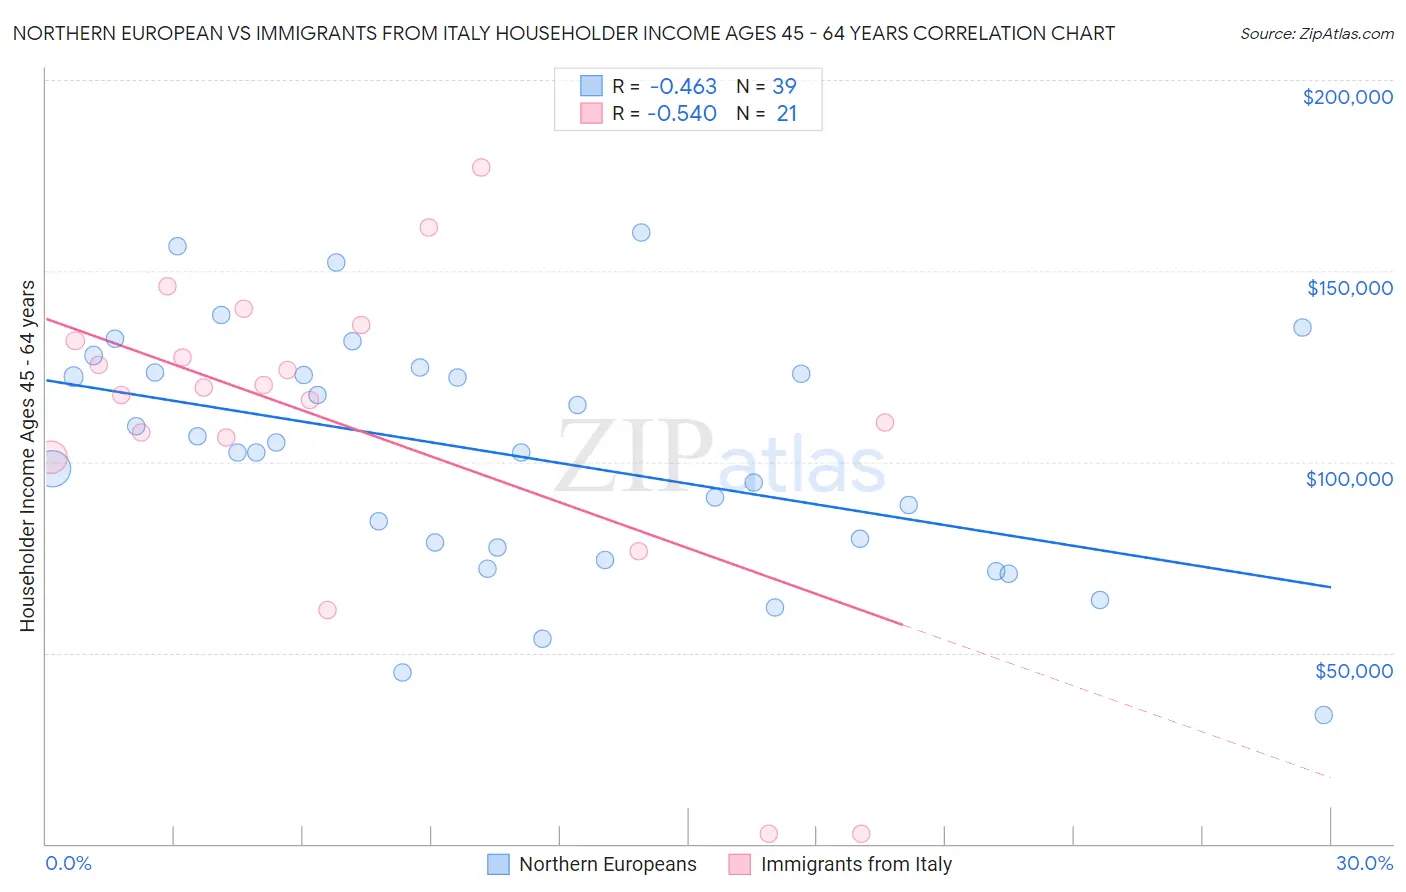
Northern European vs Immigrants from Italy Householder Income Ages 45 - 64 years Correlation Chart
The statistical analysis conducted on geographies consisting of 405,435,990 people shows a moderate negative correlation between the proportion of Northern Europeans and household income with householder between the ages 45 and 64 in the United States with a correlation coefficient (R) of -0.463 and weighted average of $107,870. Similarly, the statistical analysis conducted on geographies consisting of 323,946,333 people shows a substantial negative correlation between the proportion of Immigrants from Italy and household income with householder between the ages 45 and 64 in the United States with a correlation coefficient (R) of -0.540 and weighted average of $110,434, a difference of 2.4%.
Householder Income Ages 45 - 64 years Correlation Summary
| Measurement | Northern European | Immigrants from Italy |
| Minimum | $33,594 | $2,499 |
| Maximum | $160,179 | $177,105 |
| Range | $126,585 | $174,606 |
| Mean | $101,869 | $110,028 |
| Median | $102,539 | $119,594 |
| Interquartile 25% (IQ1) | $77,586 | $103,841 |
| Interquartile 75% (IQ3) | $123,289 | $133,761 |
| Interquartile Range (IQR) | $45,703 | $29,920 |
| Standard Deviation (Sample) | $30,827 | $43,690 |
| Standard Deviation (Population) | $30,430 | $42,637 |
Similar Demographics by Householder Income Ages 45 - 64 years
Demographics Similar to Northern Europeans by Householder Income Ages 45 - 64 years
In terms of householder income ages 45 - 64 years, the demographic groups most similar to Northern Europeans are Immigrants from Southern Europe ($107,775, a difference of 0.090%), Palestinian ($107,721, a difference of 0.14%), Immigrants from Serbia ($107,569, a difference of 0.28%), Sri Lankan ($108,270, a difference of 0.37%), and Immigrants from Hungary ($108,267, a difference of 0.37%).
| Demographics | Rating | Rank | Householder Income Ages 45 - 64 years |
| Immigrants | Philippines | 98.3 /100 | #90 | Exceptional $108,471 |
| Immigrants | Lebanon | 98.3 /100 | #91 | Exceptional $108,471 |
| Croatians | 98.3 /100 | #92 | Exceptional $108,383 |
| Immigrants | Croatia | 98.2 /100 | #93 | Exceptional $108,304 |
| Sri Lankans | 98.2 /100 | #94 | Exceptional $108,270 |
| Immigrants | Hungary | 98.2 /100 | #95 | Exceptional $108,267 |
| Immigrants | Argentina | 98.2 /100 | #96 | Exceptional $108,264 |
| Northern Europeans | 97.8 /100 | #97 | Exceptional $107,870 |
| Immigrants | Southern Europe | 97.7 /100 | #98 | Exceptional $107,775 |
| Palestinians | 97.6 /100 | #99 | Exceptional $107,721 |
| Immigrants | Serbia | 97.4 /100 | #100 | Exceptional $107,569 |
| Immigrants | Kazakhstan | 97.2 /100 | #101 | Exceptional $107,378 |
| Immigrants | Moldova | 97.1 /100 | #102 | Exceptional $107,357 |
| Syrians | 96.9 /100 | #103 | Exceptional $107,207 |
| Immigrants | Ukraine | 96.7 /100 | #104 | Exceptional $107,079 |
Demographics Similar to Immigrants from Italy by Householder Income Ages 45 - 64 years
In terms of householder income ages 45 - 64 years, the demographic groups most similar to Immigrants from Italy are Korean ($110,334, a difference of 0.090%), Immigrants from Romania ($110,633, a difference of 0.18%), Italian ($110,224, a difference of 0.19%), Assyrian/Chaldean/Syriac ($110,201, a difference of 0.21%), and Argentinean ($110,103, a difference of 0.30%).
| Demographics | Rating | Rank | Householder Income Ages 45 - 64 years |
| Immigrants | Norway | 99.7 /100 | #62 | Exceptional $111,669 |
| Mongolians | 99.6 /100 | #63 | Exceptional $111,602 |
| Immigrants | Latvia | 99.6 /100 | #64 | Exceptional $111,454 |
| Immigrants | Belarus | 99.6 /100 | #65 | Exceptional $111,430 |
| New Zealanders | 99.6 /100 | #66 | Exceptional $111,286 |
| Laotians | 99.5 /100 | #67 | Exceptional $111,051 |
| Immigrants | Romania | 99.4 /100 | #68 | Exceptional $110,633 |
| Immigrants | Italy | 99.4 /100 | #69 | Exceptional $110,434 |
| Koreans | 99.3 /100 | #70 | Exceptional $110,334 |
| Italians | 99.3 /100 | #71 | Exceptional $110,224 |
| Assyrians/Chaldeans/Syriacs | 99.3 /100 | #72 | Exceptional $110,201 |
| Argentineans | 99.3 /100 | #73 | Exceptional $110,103 |
| Immigrants | Egypt | 99.2 /100 | #74 | Exceptional $109,941 |
| South Africans | 99.1 /100 | #75 | Exceptional $109,719 |
| Paraguayans | 99.0 /100 | #76 | Exceptional $109,447 |