Immigrants from Colombia vs Trinidadian and Tobagonian Single Mother Poverty
COMPARE
Immigrants from Colombia
Trinidadian and Tobagonian
Single Mother Poverty
Single Mother Poverty Comparison
Immigrants from Colombia
Trinidadians and Tobagonians
28.5%
SINGLE MOTHER POVERTY
88.0/ 100
METRIC RATING
140th/ 347
METRIC RANK
29.6%
SINGLE MOTHER POVERTY
21.7/ 100
METRIC RATING
198th/ 347
METRIC RANK
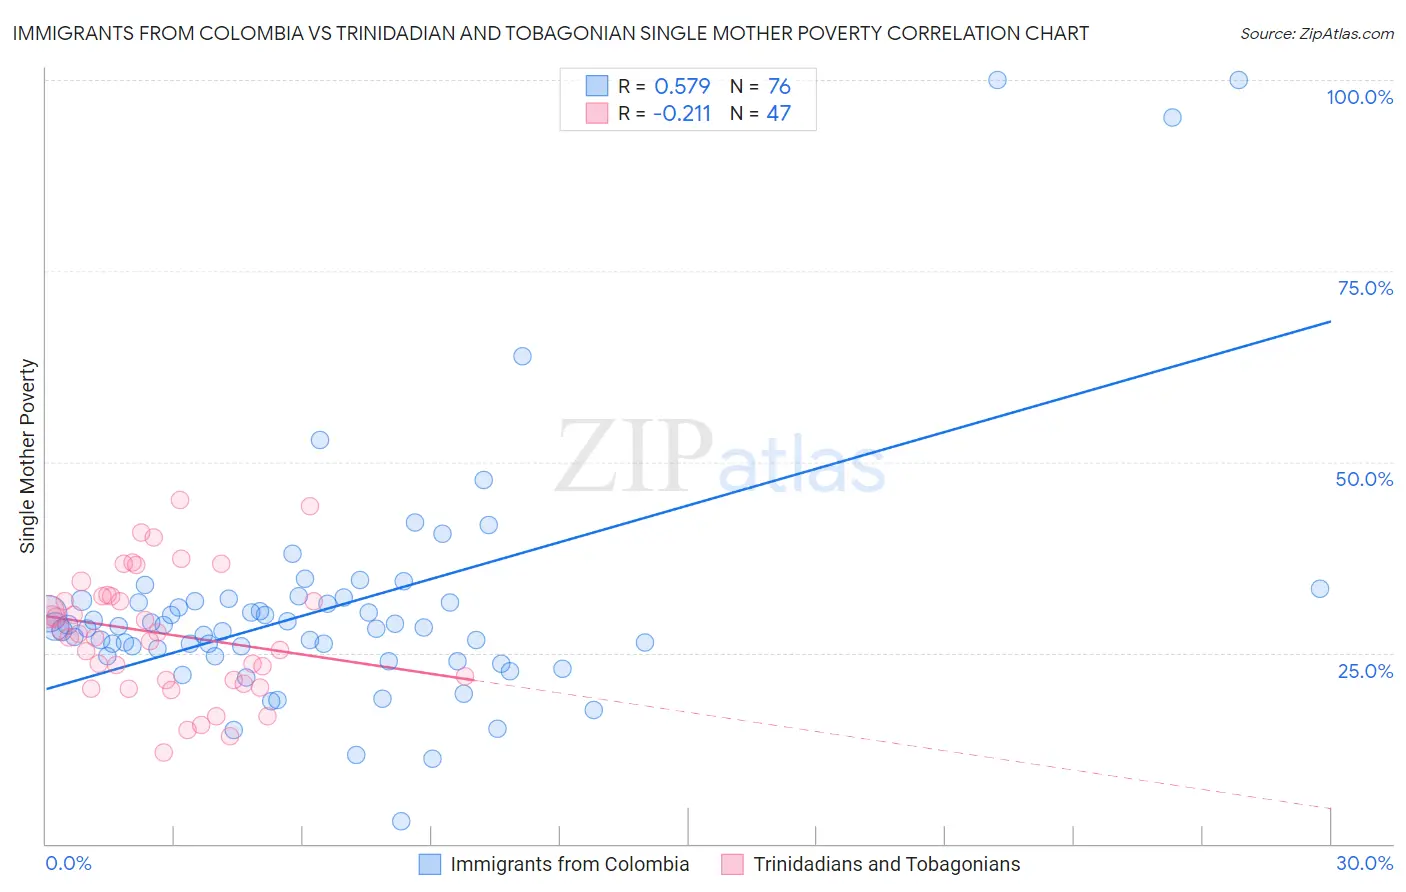
Immigrants from Colombia vs Trinidadian and Tobagonian Single Mother Poverty Correlation Chart
The statistical analysis conducted on geographies consisting of 370,210,316 people shows a substantial positive correlation between the proportion of Immigrants from Colombia and poverty level among single mothers in the United States with a correlation coefficient (R) of 0.579 and weighted average of 28.5%. Similarly, the statistical analysis conducted on geographies consisting of 216,680,407 people shows a weak negative correlation between the proportion of Trinidadians and Tobagonians and poverty level among single mothers in the United States with a correlation coefficient (R) of -0.211 and weighted average of 29.6%, a difference of 4.0%.
Single Mother Poverty Correlation Summary
| Measurement | Immigrants from Colombia | Trinidadian and Tobagonian |
| Minimum | 2.9% | 12.0% |
| Maximum | 100.0% | 45.0% |
| Range | 97.1% | 33.0% |
| Mean | 31.0% | 27.6% |
| Median | 28.3% | 27.5% |
| Interquartile 25% (IQ1) | 25.1% | 21.4% |
| Interquartile 75% (IQ3) | 31.8% | 32.5% |
| Interquartile Range (IQR) | 6.7% | 11.1% |
| Standard Deviation (Sample) | 16.2% | 8.0% |
| Standard Deviation (Population) | 16.1% | 7.9% |
Similar Demographics by Single Mother Poverty
Demographics Similar to Immigrants from Colombia by Single Mother Poverty
In terms of single mother poverty, the demographic groups most similar to Immigrants from Colombia are Samoan (28.5%, a difference of 0.010%), Immigrants from Belgium (28.5%, a difference of 0.060%), Danish (28.5%, a difference of 0.10%), Native Hawaiian (28.4%, a difference of 0.11%), and Immigrants from Canada (28.4%, a difference of 0.11%).
| Demographics | Rating | Rank | Single Mother Poverty |
| Swedes | 89.4 /100 | #133 | Excellent 28.4% |
| Immigrants | Southern Europe | 89.2 /100 | #134 | Excellent 28.4% |
| Immigrants | Spain | 89.2 /100 | #135 | Excellent 28.4% |
| Native Hawaiians | 88.9 /100 | #136 | Excellent 28.4% |
| Immigrants | Canada | 88.9 /100 | #137 | Excellent 28.4% |
| Immigrants | Belgium | 88.5 /100 | #138 | Excellent 28.5% |
| Samoans | 88.1 /100 | #139 | Excellent 28.5% |
| Immigrants | Colombia | 88.0 /100 | #140 | Excellent 28.5% |
| Danes | 87.1 /100 | #141 | Excellent 28.5% |
| South Africans | 86.6 /100 | #142 | Excellent 28.5% |
| Immigrants | North America | 86.5 /100 | #143 | Excellent 28.5% |
| Luxembourgers | 86.4 /100 | #144 | Excellent 28.5% |
| Immigrants | South America | 86.1 /100 | #145 | Excellent 28.5% |
| Immigrants | Denmark | 86.1 /100 | #146 | Excellent 28.5% |
| Immigrants | Lebanon | 85.3 /100 | #147 | Excellent 28.6% |
Demographics Similar to Trinidadians and Tobagonians by Single Mother Poverty
In terms of single mother poverty, the demographic groups most similar to Trinidadians and Tobagonians are Immigrants from Jamaica (29.6%, a difference of 0.020%), Cuban (29.6%, a difference of 0.070%), Spanish American Indian (29.6%, a difference of 0.11%), Panamanian (29.6%, a difference of 0.12%), and Slavic (29.6%, a difference of 0.18%).
| Demographics | Rating | Rank | Single Mother Poverty |
| Immigrants | Trinidad and Tobago | 29.2 /100 | #191 | Fair 29.5% |
| Moroccans | 28.6 /100 | #192 | Fair 29.5% |
| Basques | 28.3 /100 | #193 | Fair 29.5% |
| Icelanders | 26.1 /100 | #194 | Fair 29.5% |
| Slavs | 24.5 /100 | #195 | Fair 29.6% |
| Spanish American Indians | 23.4 /100 | #196 | Fair 29.6% |
| Immigrants | Jamaica | 22.0 /100 | #197 | Fair 29.6% |
| Trinidadians and Tobagonians | 21.7 /100 | #198 | Fair 29.6% |
| Cubans | 20.8 /100 | #199 | Fair 29.6% |
| Panamanians | 20.0 /100 | #200 | Fair 29.6% |
| Belgians | 18.8 /100 | #201 | Poor 29.7% |
| Malaysians | 17.4 /100 | #202 | Poor 29.7% |
| Swiss | 17.2 /100 | #203 | Poor 29.7% |
| Immigrants | Immigrants | 16.6 /100 | #204 | Poor 29.7% |
| Czechoslovakians | 16.1 /100 | #205 | Poor 29.7% |