Nonimmigrants vs Native/Alaskan Receiving Food Stamps

COMPARE

Nonimmigrants
Race
Ancestry
AfghanAfricanAlaska NativeAlaskan AthabascanAlbanianAleutAlsatianAmericanApacheArabArapahoArgentineanArmenianAssyrian/Chaldean/SyriacAustralianAustrianBahamianBangladeshiBarbadianBasqueBelgianBelizeanBermudanBhutaneseBlackfeetBolivianBrazilianBritishBritish West IndianBulgarianBurmeseCajunCambodianCanadianCape VerdeanCarpatho RusynCelticCentral AmericanCentral American IndianCherokeeCheyenneChickasawChileanChineseChippewaChoctawColombianColvilleComancheCosta RicanCreeCreekCroatianCrowCubanCypriotCzechCzechoslovakianDanishDelawareDominicanDutchDutch West IndianEastern EuropeanEcuadorianEgyptianEnglishEstonianEthiopianEuropeanFijianFilipinoFinnishFrenchFrench American IndianFrench CanadianGermanGerman RussianGhanaianGreekGuamanian/ChamorroGuatemalanGuyaneseHaitianHmongHonduranHopiHoumaHungarianIcelanderIndian (Asian)IndonesianInupiatIranianIraqiIrishIroquoisIsraeliItalianJamaicanJapaneseJordanianKenyanKiowaKoreanLaotianLatvianLebaneseLiberianLithuanianLumbeeLuxembourgerMacedonianMalaysianMalteseMarshalleseMenomineeMexicanMexican American IndianMongolianMoroccanNative HawaiianNavajoNepaleseNew ZealanderNicaraguanNigerianNorthern EuropeanNorwegianOkinawanOsageOttawaPaiutePakistaniPalestinianPanamanianParaguayanPennsylvania GermanPeruvianPimaPolishPortuguesePotawatomiPuebloPuerto RicanPuget Sound SalishRomanianRussianSalvadoranSamoanScandinavianScotch-IrishScottishSeminoleSenegaleseSerbianShoshoneSierra LeoneanSiouxSlavicSlovakSloveneSomaliSouth AfricanSouth AmericanSouth American IndianSoviet UnionSpaniardSpanishSpanish AmericanSpanish American IndianSri LankanSubsaharan AfricanSudaneseSwedishSwissSyrianTaiwaneseThaiTlingit-HaidaTohono O'OdhamTonganTrinidadian and TobagonianTsimshianTurkishU.S. Virgin IslanderUgandanUkrainianUruguayanUteVenezuelanVietnameseWelshWest IndianYakamaYaquiYugoslavianYumanYup'ikZimbabwean
Immigration
NonimmigrantsImmigrantsAfghanistanAfricaAlbaniaArgentinaArmeniaAsiaAustraliaAustriaBahamasBangladeshBarbadosBelarusBelgiumBelizeBoliviaBosnia and HerzegovinaBrazilBulgariaBurma/MyanmarCabo VerdeCambodiaCameroonCanadaCaribbeanCentral AmericaChileChinaColombiaCongoCosta RicaCroatiaCubaCzechoslovakiaDenmarkDominicaDominican RepublicEastern AfricaEastern AsiaEastern EuropeEcuadorEgyptEl SalvadorEnglandEritreaEthiopiaEuropeFijiFranceGermanyGhanaGreeceGrenadaGuatemalaGuyanaHaitiHondurasHong KongHungaryIndiaIndonesiaIranIraqIrelandIsraelItalyJamaicaJapanJordanKazakhstanKenyaKoreaKuwaitLaosLatin AmericaLatviaLebanonLiberiaLithuaniaMalaysiaMexicoMicronesiaMiddle AfricaMoldovaMoroccoNepalNetherlandsNicaraguaNigeriaNorth AmericaNorth MacedoniaNorthern AfricaNorthern EuropeNorwayOceaniaPakistanPanamaPeruPhilippinesPolandPortugalRomaniaRussiaSaudi ArabiaScotlandSenegalSerbiaSierra LeoneSingaporeSomaliaSouth AfricaSouth AmericaSouth Central AsiaSouth Eastern AsiaSouthern EuropeSpainSri LankaSt. Vincent and the GrenadinesSudanSwedenSwitzerlandSyriaTaiwanThailandTrinidad and TobagoTurkeyUgandaUkraineUruguayUzbekistanVenezuelaVietnamWest IndiesWestern AfricaWestern AsiaWestern EuropeYemenZaireZimbabweAzores
Native/Alaskan
Race
Ancestry
AfghanAfricanAlaska NativeAlaskan AthabascanAlbanianAleutAlsatianAmericanApacheArabArapahoArgentineanArmenianAssyrian/Chaldean/SyriacAustralianAustrianBahamianBangladeshiBarbadianBasqueBelgianBelizeanBermudanBhutaneseBlackfeetBolivianBrazilianBritishBritish West IndianBulgarianBurmeseCajunCambodianCanadianCape VerdeanCarpatho RusynCelticCentral AmericanCentral American IndianCherokeeCheyenneChickasawChileanChineseChippewaChoctawColombianColvilleComancheCosta RicanCreeCreekCroatianCrowCubanCypriotCzechCzechoslovakianDanishDelawareDominicanDutchDutch West IndianEastern EuropeanEcuadorianEgyptianEnglishEstonianEthiopianEuropeanFijianFilipinoFinnishFrenchFrench American IndianFrench CanadianGermanGerman RussianGhanaianGreekGuamanian/ChamorroGuatemalanGuyaneseHaitianHmongHonduranHopiHoumaHungarianIcelanderIndian (Asian)IndonesianInupiatIranianIraqiIrishIroquoisIsraeliItalianJamaicanJapaneseJordanianKenyanKiowaKoreanLaotianLatvianLebaneseLiberianLithuanianLumbeeLuxembourgerMacedonianMalaysianMalteseMarshalleseMenomineeMexicanMexican American IndianMongolianMoroccanNative HawaiianNavajoNepaleseNew ZealanderNicaraguanNigerianNorthern EuropeanNorwegianOkinawanOsageOttawaPaiutePakistaniPalestinianPanamanianParaguayanPennsylvania GermanPeruvianPimaPolishPortuguesePotawatomiPuebloPuerto RicanPuget Sound SalishRomanianRussianSalvadoranSamoanScandinavianScotch-IrishScottishSeminoleSenegaleseSerbianShoshoneSierra LeoneanSiouxSlavicSlovakSloveneSomaliSouth AfricanSouth AmericanSouth American IndianSoviet UnionSpaniardSpanishSpanish AmericanSpanish American IndianSri LankanSubsaharan AfricanSudaneseSwedishSwissSyrianTaiwaneseThaiTlingit-HaidaTohono O'OdhamTonganTrinidadian and TobagonianTsimshianTurkishU.S. Virgin IslanderUgandanUkrainianUruguayanUteVenezuelanVietnameseWelshWest IndianYakamaYaquiYugoslavianYumanYup'ikZimbabwean
Immigration
ImmigrantsAfghanistanAfricaAlbaniaArgentinaArmeniaAsiaAustraliaAustriaBahamasBangladeshBarbadosBelarusBelgiumBelizeBoliviaBosnia and HerzegovinaBrazilBulgariaBurma/MyanmarCabo VerdeCambodiaCameroonCanadaCaribbeanCentral AmericaChileChinaColombiaCongoCosta RicaCroatiaCubaCzechoslovakiaDenmarkDominicaDominican RepublicEastern AfricaEastern AsiaEastern EuropeEcuadorEgyptEl SalvadorEnglandEritreaEthiopiaEuropeFijiFranceGermanyGhanaGreeceGrenadaGuatemalaGuyanaHaitiHondurasHong KongHungaryIndiaIndonesiaIranIraqIrelandIsraelItalyJamaicaJapanJordanKazakhstanKenyaKoreaKuwaitLaosLatin AmericaLatviaLebanonLiberiaLithuaniaMalaysiaMexicoMicronesiaMiddle AfricaMoldovaMoroccoNepalNetherlandsNicaraguaNigeriaNorth AmericaNorth MacedoniaNorthern AfricaNorthern EuropeNorwayOceaniaPakistanPanamaPeruPhilippinesPolandPortugalRomaniaRussiaSaudi ArabiaScotlandSenegalSerbiaSierra LeoneSingaporeSomaliaSouth AfricaSouth AmericaSouth Central AsiaSouth Eastern AsiaSouthern EuropeSpainSri LankaSt. Vincent and the GrenadinesSudanSwedenSwitzerlandSyriaTaiwanThailandTrinidad and TobagoTurkeyUgandaUkraineUruguayUzbekistanVenezuelaVietnamWest IndiesWestern AfricaWestern AsiaWestern EuropeYemenZaireZimbabweAzores
Receiving Food Stamps
Income
Poverty
Unemployment
Labor Participation
Family Structure
Vehicle Availability
Education Level
Disability

Receiving Food Stamps Comparison

Nonimmigrants

Natives/Alaskans

Poor
Tragic
12.4%
RECEIVING FOOD STAMPS
17.6/ 100
METRIC RATING
204th/ 347
METRIC RANK
17.3%
RECEIVING FOOD STAMPS
0.0/ 100
METRIC RATING
321st/ 347
METRIC RANK

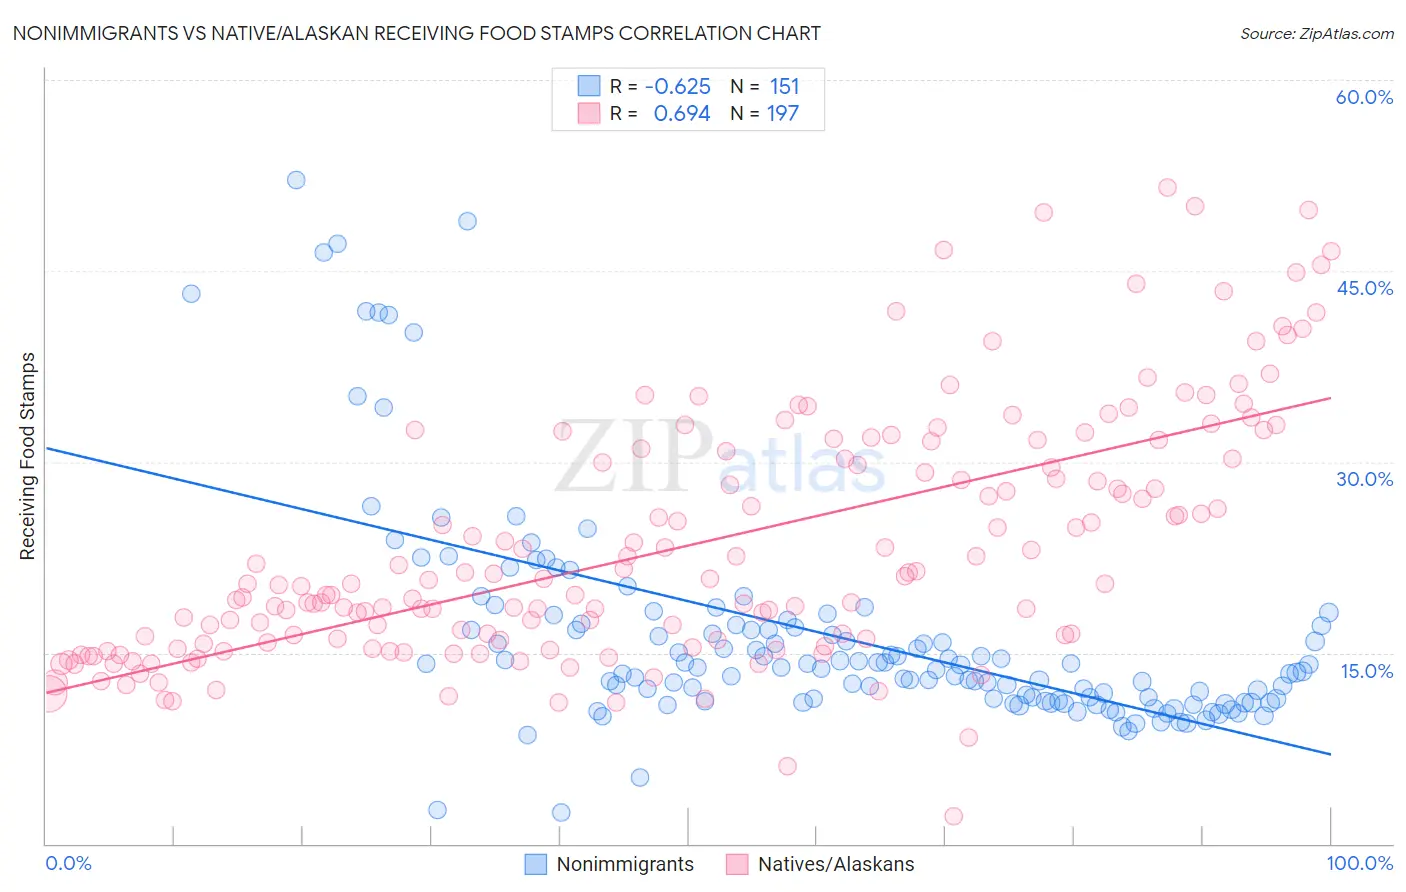
Nonimmigrants vs Native/Alaskan Receiving Food Stamps Correlation Chart

The statistical analysis conducted on geographies consisting of 580,622,931 people shows a significant negative correlation between the proportion of Nonimmigrants and percentage of population receiving government assistance and/or food stamps in the United States with a correlation coefficient (R) of -0.625 and weighted average of 12.4%. Similarly, the statistical analysis conducted on geographies consisting of 511,480,561 people shows a significant positive correlation between the proportion of Natives/Alaskans and percentage of population receiving government assistance and/or food stamps in the United States with a correlation coefficient (R) of 0.694 and weighted average of 17.3%, a difference of 39.6%.
Nonimmigrants vs Native/Alaskan Receiving Food Stamps

Receiving Food Stamps Correlation Summary

MeasurementNonimmigrantsNative/Alaskan
Minimum2.4%2.2%
Maximum52.1%51.6%
Range49.7%49.4%
Mean16.2%23.4%
Median13.8%20.4%
Interquartile 25% (IQ1)11.2%15.8%
Interquartile 75% (IQ3)17.1%30.5%
Interquartile Range (IQR)5.9%14.7%
Standard Deviation (Sample)8.7%9.7%
Standard Deviation (Population)8.6%9.7%

Similar Demographics by Receiving Food Stamps

Demographics Similar to Nonimmigrants by Receiving Food Stamps

In terms of receiving food stamps, the demographic groups most similar to Nonimmigrants are Shoshone (12.4%, a difference of 0.030%), Aleut (12.4%, a difference of 0.070%), Immigrants from Thailand (12.4%, a difference of 0.13%), South American (12.4%, a difference of 0.39%), and Immigrants from Venezuela (12.3%, a difference of 0.56%).
DemographicsRating | RankReceiving Food Stamps
Delaware
26.1
/100
|
#197
Fair
12.2%
Immigrants | Costa Rica
25.4
/100
|
#198
Fair
12.2%
Portuguese
25.1
/100
|
#199
Fair
12.2%
Sierra Leoneans
23.6
/100
|
#200
Fair
12.2%
Ugandans
22.5
/100
|
#201
Fair
12.2%
Immigrants | Venezuela
20.1
/100
|
#202
Fair
12.3%
Shoshone
17.7
/100
|
#203
Poor
12.4%
Immigrants | Nonimmigrants
17.6
/100
|
#204
Poor
12.4%
Aleuts
17.3
/100
|
#205
Poor
12.4%
Immigrants | Thailand
17.0
/100
|
#206
Poor
12.4%
South Americans
16.0
/100
|
#207
Poor
12.4%
Potawatomi
14.6
/100
|
#208
Poor
12.5%
Immigrants | Sierra Leone
12.9
/100
|
#209
Poor
12.5%
Immigrants | Uruguay
12.8
/100
|
#210
Poor
12.5%
Colombians
10.2
/100
|
#211
Poor
12.6%

Demographics Similar to Natives/Alaskans by Receiving Food Stamps

In terms of receiving food stamps, the demographic groups most similar to Natives/Alaskans are Immigrants from Nicaragua (17.2%, a difference of 0.18%), Immigrants from St. Vincent and the Grenadines (17.2%, a difference of 0.26%), Menominee (17.2%, a difference of 0.44%), Black/African American (17.2%, a difference of 0.62%), and Central American Indian (17.1%, a difference of 1.1%).
DemographicsRating | RankReceiving Food Stamps
Immigrants | Guyana
0.0
/100
|
#314
Tragic
16.9%
Bahamians
0.0
/100
|
#315
Tragic
17.0%
Central American Indians
0.0
/100
|
#316
Tragic
17.1%
Blacks/African Americans
0.0
/100
|
#317
Tragic
17.2%
Menominee
0.0
/100
|
#318
Tragic
17.2%
Immigrants | St. Vincent and the Grenadines
0.0
/100
|
#319
Tragic
17.2%
Immigrants | Nicaragua
0.0
/100
|
#320
Tragic
17.2%
Natives/Alaskans
0.0
/100
|
#321
Tragic
17.3%
Immigrants | Grenada
0.0
/100
|
#322
Tragic
17.8%
Haitians
0.0
/100
|
#323
Tragic
17.8%
British West Indians
0.0
/100
|
#324
Tragic
17.9%
Immigrants | Haiti
0.0
/100
|
#325
Tragic
18.2%
Cubans
0.0
/100
|
#326
Tragic
18.2%
Apache
0.0
/100
|
#327
Tragic
18.3%
Colville
0.0
/100
|
#328
Tragic
18.3%