Nonimmigrants vs Immigrants from Uzbekistan Receiving Food Stamps

COMPARE

Nonimmigrants
Race
Ancestry
AfghanAfricanAlaska NativeAlaskan AthabascanAlbanianAleutAlsatianAmericanApacheArabArapahoArgentineanArmenianAssyrian/Chaldean/SyriacAustralianAustrianBahamianBangladeshiBarbadianBasqueBelgianBelizeanBermudanBhutaneseBlackfeetBolivianBrazilianBritishBritish West IndianBulgarianBurmeseCajunCambodianCanadianCape VerdeanCarpatho RusynCelticCentral AmericanCentral American IndianCherokeeCheyenneChickasawChileanChineseChippewaChoctawColombianColvilleComancheCosta RicanCreeCreekCroatianCrowCubanCypriotCzechCzechoslovakianDanishDelawareDominicanDutchDutch West IndianEastern EuropeanEcuadorianEgyptianEnglishEstonianEthiopianEuropeanFijianFilipinoFinnishFrenchFrench American IndianFrench CanadianGermanGerman RussianGhanaianGreekGuamanian/ChamorroGuatemalanGuyaneseHaitianHmongHonduranHopiHoumaHungarianIcelanderIndian (Asian)IndonesianInupiatIranianIraqiIrishIroquoisIsraeliItalianJamaicanJapaneseJordanianKenyanKiowaKoreanLaotianLatvianLebaneseLiberianLithuanianLumbeeLuxembourgerMacedonianMalaysianMalteseMarshalleseMenomineeMexicanMexican American IndianMongolianMoroccanNative HawaiianNavajoNepaleseNew ZealanderNicaraguanNigerianNorthern EuropeanNorwegianOkinawanOsageOttawaPaiutePakistaniPalestinianPanamanianParaguayanPennsylvania GermanPeruvianPimaPolishPortuguesePotawatomiPuebloPuerto RicanPuget Sound SalishRomanianRussianSalvadoranSamoanScandinavianScotch-IrishScottishSeminoleSenegaleseSerbianShoshoneSierra LeoneanSiouxSlavicSlovakSloveneSomaliSouth AfricanSouth AmericanSouth American IndianSoviet UnionSpaniardSpanishSpanish AmericanSpanish American IndianSri LankanSubsaharan AfricanSudaneseSwedishSwissSyrianTaiwaneseThaiTlingit-HaidaTohono O'OdhamTonganTrinidadian and TobagonianTsimshianTurkishU.S. Virgin IslanderUgandanUkrainianUruguayanUteVenezuelanVietnameseWelshWest IndianYakamaYaquiYugoslavianYumanYup'ikZimbabwean
Immigration
NonimmigrantsImmigrantsAfghanistanAfricaAlbaniaArgentinaArmeniaAsiaAustraliaAustriaBahamasBangladeshBarbadosBelarusBelgiumBelizeBoliviaBosnia and HerzegovinaBrazilBulgariaBurma/MyanmarCabo VerdeCambodiaCameroonCanadaCaribbeanCentral AmericaChileChinaColombiaCongoCosta RicaCroatiaCubaCzechoslovakiaDenmarkDominicaDominican RepublicEastern AfricaEastern AsiaEastern EuropeEcuadorEgyptEl SalvadorEnglandEritreaEthiopiaEuropeFijiFranceGermanyGhanaGreeceGrenadaGuatemalaGuyanaHaitiHondurasHong KongHungaryIndiaIndonesiaIranIraqIrelandIsraelItalyJamaicaJapanJordanKazakhstanKenyaKoreaKuwaitLaosLatin AmericaLatviaLebanonLiberiaLithuaniaMalaysiaMexicoMicronesiaMiddle AfricaMoldovaMoroccoNepalNetherlandsNicaraguaNigeriaNorth AmericaNorth MacedoniaNorthern AfricaNorthern EuropeNorwayOceaniaPakistanPanamaPeruPhilippinesPolandPortugalRomaniaRussiaSaudi ArabiaScotlandSenegalSerbiaSierra LeoneSingaporeSomaliaSouth AfricaSouth AmericaSouth Central AsiaSouth Eastern AsiaSouthern EuropeSpainSri LankaSt. Vincent and the GrenadinesSudanSwedenSwitzerlandSyriaTaiwanThailandTrinidad and TobagoTurkeyUgandaUkraineUruguayVenezuelaVietnamWest IndiesWestern AfricaWestern AsiaWestern EuropeYemenZaireZimbabweAzores
Immigrants from Uzbekistan
Race
Ancestry
AfghanAfricanAlaska NativeAlaskan AthabascanAlbanianAleutAlsatianAmericanApacheArabArapahoArgentineanArmenianAssyrian/Chaldean/SyriacAustralianAustrianBahamianBangladeshiBarbadianBasqueBelgianBelizeanBermudanBhutaneseBlackfeetBolivianBrazilianBritishBritish West IndianBulgarianBurmeseCajunCambodianCanadianCape VerdeanCarpatho RusynCelticCentral AmericanCentral American IndianCherokeeCheyenneChickasawChileanChineseChippewaChoctawColombianColvilleComancheCosta RicanCreeCreekCroatianCrowCubanCypriotCzechCzechoslovakianDanishDelawareDominicanDutchDutch West IndianEastern EuropeanEcuadorianEgyptianEnglishEstonianEthiopianEuropeanFijianFilipinoFinnishFrenchFrench American IndianFrench CanadianGermanGerman RussianGhanaianGreekGuamanian/ChamorroGuatemalanGuyaneseHaitianHmongHonduranHopiHoumaHungarianIcelanderIndian (Asian)IndonesianInupiatIranianIraqiIrishIroquoisIsraeliItalianJamaicanJapaneseJordanianKenyanKiowaKoreanLaotianLatvianLebaneseLiberianLithuanianLumbeeLuxembourgerMacedonianMalaysianMalteseMarshalleseMenomineeMexicanMexican American IndianMongolianMoroccanNative HawaiianNavajoNepaleseNew ZealanderNicaraguanNigerianNorthern EuropeanNorwegianOkinawanOsageOttawaPaiutePakistaniPalestinianPanamanianParaguayanPennsylvania GermanPeruvianPimaPolishPortuguesePotawatomiPuebloPuerto RicanPuget Sound SalishRomanianRussianSalvadoranSamoanScandinavianScotch-IrishScottishSeminoleSenegaleseSerbianShoshoneSierra LeoneanSiouxSlavicSlovakSloveneSomaliSouth AfricanSouth AmericanSouth American IndianSoviet UnionSpaniardSpanishSpanish AmericanSpanish American IndianSri LankanSubsaharan AfricanSudaneseSwedishSwissSyrianTaiwaneseThaiTlingit-HaidaTohono O'OdhamTonganTrinidadian and TobagonianTsimshianTurkishU.S. Virgin IslanderUgandanUkrainianUruguayanUteVenezuelanVietnameseWelshWest IndianYakamaYaquiYugoslavianYumanYup'ikZimbabwean
Immigration
ImmigrantsAfghanistanAfricaAlbaniaArgentinaArmeniaAsiaAustraliaAustriaBahamasBangladeshBarbadosBelarusBelgiumBelizeBoliviaBosnia and HerzegovinaBrazilBulgariaBurma/MyanmarCabo VerdeCambodiaCameroonCanadaCaribbeanCentral AmericaChileChinaColombiaCongoCosta RicaCroatiaCubaCzechoslovakiaDenmarkDominicaDominican RepublicEastern AfricaEastern AsiaEastern EuropeEcuadorEgyptEl SalvadorEnglandEritreaEthiopiaEuropeFijiFranceGermanyGhanaGreeceGrenadaGuatemalaGuyanaHaitiHondurasHong KongHungaryIndiaIndonesiaIranIraqIrelandIsraelItalyJamaicaJapanJordanKazakhstanKenyaKoreaKuwaitLaosLatin AmericaLatviaLebanonLiberiaLithuaniaMalaysiaMexicoMicronesiaMiddle AfricaMoldovaMoroccoNepalNetherlandsNicaraguaNigeriaNorth AmericaNorth MacedoniaNorthern AfricaNorthern EuropeNorwayOceaniaPakistanPanamaPeruPhilippinesPolandPortugalRomaniaRussiaSaudi ArabiaScotlandSenegalSerbiaSierra LeoneSingaporeSomaliaSouth AfricaSouth AmericaSouth Central AsiaSouth Eastern AsiaSouthern EuropeSpainSri LankaSt. Vincent and the GrenadinesSudanSwedenSwitzerlandSyriaTaiwanThailandTrinidad and TobagoTurkeyUgandaUkraineUruguayUzbekistanVenezuelaVietnamWest IndiesWestern AfricaWestern AsiaWestern EuropeYemenZaireZimbabweAzores
Receiving Food Stamps
Income
Poverty
Unemployment
Labor Participation
Family Structure
Vehicle Availability
Education Level
Disability

Receiving Food Stamps Comparison

Nonimmigrants

Immigrants from Uzbekistan

Poor
Tragic
12.4%
RECEIVING FOOD STAMPS
17.6/ 100
METRIC RATING
204th/ 347
METRIC RANK
14.3%
RECEIVING FOOD STAMPS
0.2/ 100
METRIC RATING
264th/ 347
METRIC RANK

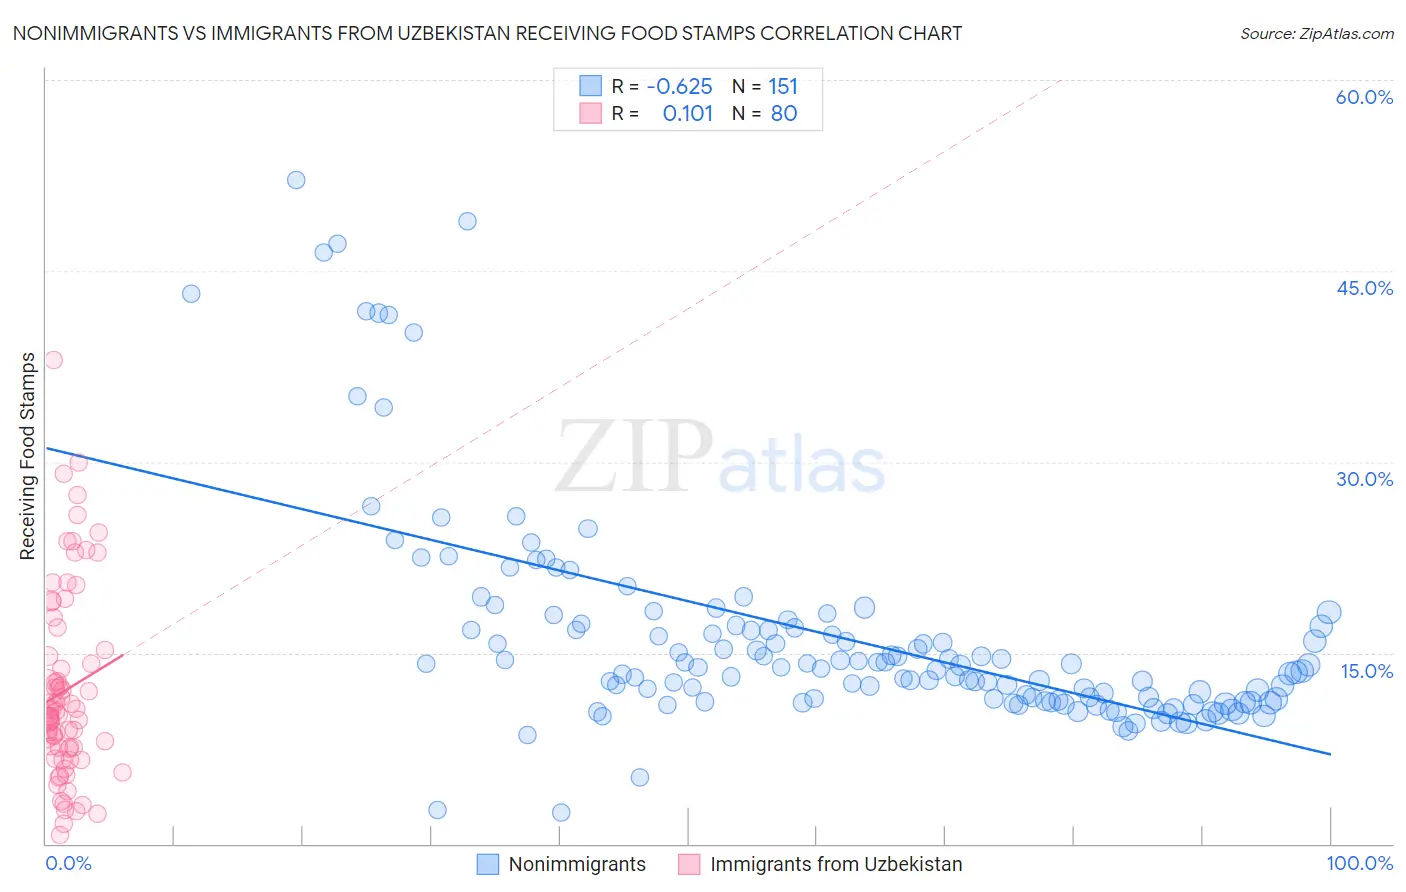
Nonimmigrants vs Immigrants from Uzbekistan Receiving Food Stamps Correlation Chart

The statistical analysis conducted on geographies consisting of 580,622,931 people shows a significant negative correlation between the proportion of Nonimmigrants and percentage of population receiving government assistance and/or food stamps in the United States with a correlation coefficient (R) of -0.625 and weighted average of 12.4%. Similarly, the statistical analysis conducted on geographies consisting of 118,563,262 people shows a poor positive correlation between the proportion of Immigrants from Uzbekistan and percentage of population receiving government assistance and/or food stamps in the United States with a correlation coefficient (R) of 0.101 and weighted average of 14.3%, a difference of 15.4%.
Nonimmigrants vs Immigrants from Uzbekistan Receiving Food Stamps

Receiving Food Stamps Correlation Summary

MeasurementNonimmigrantsImmigrants from Uzbekistan
Minimum2.4%0.70%
Maximum52.1%38.0%
Range49.7%37.3%
Mean16.2%12.1%
Median13.8%10.1%
Interquartile 25% (IQ1)11.2%7.5%
Interquartile 75% (IQ3)17.1%15.0%
Interquartile Range (IQR)5.9%7.4%
Standard Deviation (Sample)8.7%7.5%
Standard Deviation (Population)8.6%7.4%

Similar Demographics by Receiving Food Stamps

Demographics Similar to Nonimmigrants by Receiving Food Stamps

In terms of receiving food stamps, the demographic groups most similar to Nonimmigrants are Shoshone (12.4%, a difference of 0.030%), Aleut (12.4%, a difference of 0.070%), Immigrants from Thailand (12.4%, a difference of 0.13%), South American (12.4%, a difference of 0.39%), and Immigrants from Venezuela (12.3%, a difference of 0.56%).
DemographicsRating | RankReceiving Food Stamps
Delaware
26.1
/100
|
#197
Fair
12.2%
Immigrants | Costa Rica
25.4
/100
|
#198
Fair
12.2%
Portuguese
25.1
/100
|
#199
Fair
12.2%
Sierra Leoneans
23.6
/100
|
#200
Fair
12.2%
Ugandans
22.5
/100
|
#201
Fair
12.2%
Immigrants | Venezuela
20.1
/100
|
#202
Fair
12.3%
Shoshone
17.7
/100
|
#203
Poor
12.4%
Immigrants | Nonimmigrants
17.6
/100
|
#204
Poor
12.4%
Aleuts
17.3
/100
|
#205
Poor
12.4%
Immigrants | Thailand
17.0
/100
|
#206
Poor
12.4%
South Americans
16.0
/100
|
#207
Poor
12.4%
Potawatomi
14.6
/100
|
#208
Poor
12.5%
Immigrants | Sierra Leone
12.9
/100
|
#209
Poor
12.5%
Immigrants | Uruguay
12.8
/100
|
#210
Poor
12.5%
Colombians
10.2
/100
|
#211
Poor
12.6%

Demographics Similar to Immigrants from Uzbekistan by Receiving Food Stamps

In terms of receiving food stamps, the demographic groups most similar to Immigrants from Uzbekistan are Blackfeet (14.3%, a difference of 0.050%), Immigrants from Portugal (14.3%, a difference of 0.090%), Paiute (14.3%, a difference of 0.10%), Cheyenne (14.3%, a difference of 0.14%), and Dutch West Indian (14.3%, a difference of 0.36%).
DemographicsRating | RankReceiving Food Stamps
Arapaho
0.3
/100
|
#257
Tragic
14.1%
Immigrants | Ghana
0.3
/100
|
#258
Tragic
14.1%
Creek
0.3
/100
|
#259
Tragic
14.1%
Central Americans
0.3
/100
|
#260
Tragic
14.1%
Immigrants | Congo
0.3
/100
|
#261
Tragic
14.1%
Paiute
0.2
/100
|
#262
Tragic
14.3%
Immigrants | Portugal
0.2
/100
|
#263
Tragic
14.3%
Immigrants | Uzbekistan
0.2
/100
|
#264
Tragic
14.3%
Blackfeet
0.2
/100
|
#265
Tragic
14.3%
Cheyenne
0.2
/100
|
#266
Tragic
14.3%
Dutch West Indians
0.2
/100
|
#267
Tragic
14.3%
Guatemalans
0.1
/100
|
#268
Tragic
14.4%
Nepalese
0.1
/100
|
#269
Tragic
14.6%
Mexicans
0.1
/100
|
#270
Tragic
14.6%
Immigrants | Guatemala
0.1
/100
|
#271
Tragic
14.6%