Nonimmigrants vs Native/Alaskan Disability Age Over 75
COMPARE
Nonimmigrants
Native/Alaskan
Disability Age Over 75
Disability Age Over 75 Comparison
Nonimmigrants
Natives/Alaskans
48.0%
DISABILITY AGE OVER 75
6.5/ 100
METRIC RATING
226th/ 347
METRIC RANK
53.1%
DISABILITY AGE OVER 75
0.0/ 100
METRIC RATING
332nd/ 347
METRIC RANK
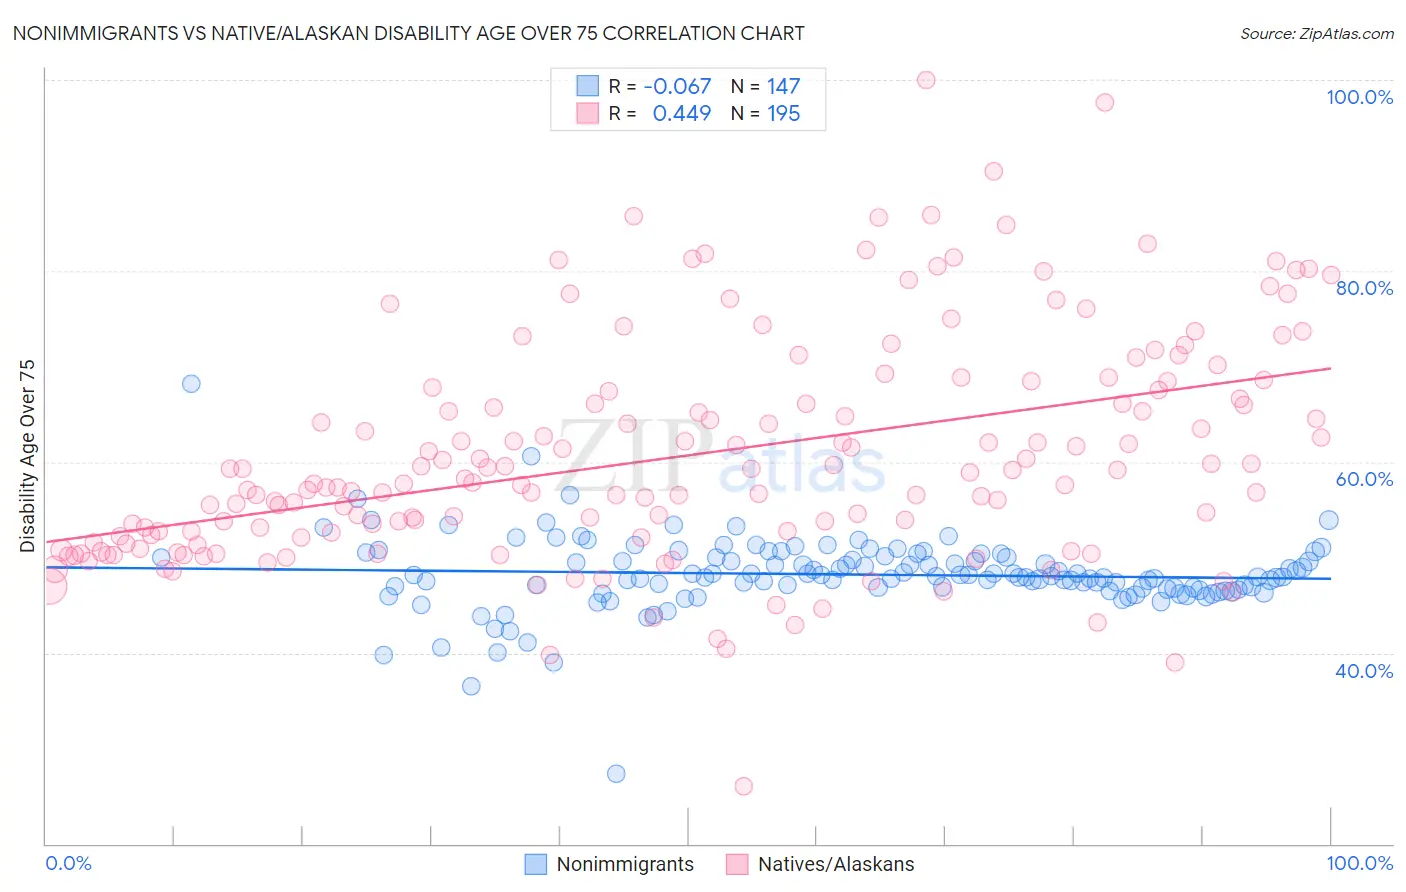
Nonimmigrants vs Native/Alaskan Disability Age Over 75 Correlation Chart
The statistical analysis conducted on geographies consisting of 582,018,698 people shows a slight negative correlation between the proportion of Nonimmigrants and percentage of population with a disability over the age of 75 in the United States with a correlation coefficient (R) of -0.067 and weighted average of 48.0%. Similarly, the statistical analysis conducted on geographies consisting of 511,593,286 people shows a moderate positive correlation between the proportion of Natives/Alaskans and percentage of population with a disability over the age of 75 in the United States with a correlation coefficient (R) of 0.449 and weighted average of 53.1%, a difference of 10.4%.
Disability Age Over 75 Correlation Summary
| Measurement | Nonimmigrants | Native/Alaskan |
| Minimum | 27.4% | 26.0% |
| Maximum | 68.2% | 100.0% |
| Range | 40.9% | 74.0% |
| Mean | 48.2% | 60.6% |
| Median | 47.9% | 57.9% |
| Interquartile 25% (IQ1) | 46.7% | 52.1% |
| Interquartile 75% (IQ3) | 50.0% | 67.5% |
| Interquartile Range (IQR) | 3.3% | 15.4% |
| Standard Deviation (Sample) | 4.0% | 11.8% |
| Standard Deviation (Population) | 4.0% | 11.8% |
Similar Demographics by Disability Age Over 75
Demographics Similar to Nonimmigrants by Disability Age Over 75
In terms of disability age over 75, the demographic groups most similar to Nonimmigrants are Spanish (48.0%, a difference of 0.010%), Zimbabwean (48.1%, a difference of 0.010%), Liberian (48.0%, a difference of 0.020%), Barbadian (48.0%, a difference of 0.030%), and Immigrants from Bangladesh (48.0%, a difference of 0.030%).
| Demographics | Rating | Rank | Disability Age Over 75 |
| Immigrants | Western Asia | 7.5 /100 | #219 | Tragic 48.0% |
| Bahamians | 7.4 /100 | #220 | Tragic 48.0% |
| Immigrants | Oceania | 7.3 /100 | #221 | Tragic 48.0% |
| Barbadians | 6.8 /100 | #222 | Tragic 48.0% |
| Immigrants | Bangladesh | 6.8 /100 | #223 | Tragic 48.0% |
| Liberians | 6.7 /100 | #224 | Tragic 48.0% |
| Spanish | 6.5 /100 | #225 | Tragic 48.0% |
| Immigrants | Nonimmigrants | 6.5 /100 | #226 | Tragic 48.0% |
| Zimbabweans | 6.4 /100 | #227 | Tragic 48.1% |
| Immigrants | Liberia | 5.9 /100 | #228 | Tragic 48.1% |
| Spaniards | 5.7 /100 | #229 | Tragic 48.1% |
| Taiwanese | 4.4 /100 | #230 | Tragic 48.2% |
| Immigrants | Immigrants | 4.3 /100 | #231 | Tragic 48.2% |
| Indonesians | 4.2 /100 | #232 | Tragic 48.2% |
| Cree | 4.2 /100 | #233 | Tragic 48.2% |
Demographics Similar to Natives/Alaskans by Disability Age Over 75
In terms of disability age over 75, the demographic groups most similar to Natives/Alaskans are Hopi (52.9%, a difference of 0.29%), Puerto Rican (52.9%, a difference of 0.31%), Alaska Native (52.8%, a difference of 0.49%), Choctaw (52.7%, a difference of 0.70%), and Nepalese (52.6%, a difference of 0.89%).
| Demographics | Rating | Rank | Disability Age Over 75 |
| Immigrants | Cabo Verde | 0.0 /100 | #325 | Tragic 52.4% |
| Ute | 0.0 /100 | #326 | Tragic 52.6% |
| Nepalese | 0.0 /100 | #327 | Tragic 52.6% |
| Choctaw | 0.0 /100 | #328 | Tragic 52.7% |
| Alaska Natives | 0.0 /100 | #329 | Tragic 52.8% |
| Puerto Ricans | 0.0 /100 | #330 | Tragic 52.9% |
| Hopi | 0.0 /100 | #331 | Tragic 52.9% |
| Natives/Alaskans | 0.0 /100 | #332 | Tragic 53.1% |
| Apache | 0.0 /100 | #333 | Tragic 53.6% |
| Alaskan Athabascans | 0.0 /100 | #334 | Tragic 54.0% |
| Kiowa | 0.0 /100 | #335 | Tragic 54.2% |
| Immigrants | Armenia | 0.0 /100 | #336 | Tragic 54.3% |
| Yuman | 0.0 /100 | #337 | Tragic 54.4% |
| Colville | 0.0 /100 | #338 | Tragic 55.4% |
| Pima | 0.0 /100 | #339 | Tragic 55.8% |