Nonimmigrants vs Slavic Receiving Food Stamps

COMPARE

Nonimmigrants
Race
Ancestry
AfghanAfricanAlaska NativeAlaskan AthabascanAlbanianAleutAlsatianAmericanApacheArabArapahoArgentineanArmenianAssyrian/Chaldean/SyriacAustralianAustrianBahamianBangladeshiBarbadianBasqueBelgianBelizeanBermudanBhutaneseBlackfeetBolivianBrazilianBritishBritish West IndianBulgarianBurmeseCajunCambodianCanadianCape VerdeanCarpatho RusynCelticCentral AmericanCentral American IndianCherokeeCheyenneChickasawChileanChineseChippewaChoctawColombianColvilleComancheCosta RicanCreeCreekCroatianCrowCubanCypriotCzechCzechoslovakianDanishDelawareDominicanDutchDutch West IndianEastern EuropeanEcuadorianEgyptianEnglishEstonianEthiopianEuropeanFijianFilipinoFinnishFrenchFrench American IndianFrench CanadianGermanGerman RussianGhanaianGreekGuamanian/ChamorroGuatemalanGuyaneseHaitianHmongHonduranHopiHoumaHungarianIcelanderIndian (Asian)IndonesianInupiatIranianIraqiIrishIroquoisIsraeliItalianJamaicanJapaneseJordanianKenyanKiowaKoreanLaotianLatvianLebaneseLiberianLithuanianLumbeeLuxembourgerMacedonianMalaysianMalteseMarshalleseMenomineeMexicanMexican American IndianMongolianMoroccanNative HawaiianNavajoNepaleseNew ZealanderNicaraguanNigerianNorthern EuropeanNorwegianOkinawanOsageOttawaPaiutePakistaniPalestinianPanamanianParaguayanPennsylvania GermanPeruvianPimaPolishPortuguesePotawatomiPuebloPuerto RicanPuget Sound SalishRomanianRussianSalvadoranSamoanScandinavianScotch-IrishScottishSeminoleSenegaleseSerbianShoshoneSierra LeoneanSiouxSlovakSloveneSomaliSouth AfricanSouth AmericanSouth American IndianSoviet UnionSpaniardSpanishSpanish AmericanSpanish American IndianSri LankanSubsaharan AfricanSudaneseSwedishSwissSyrianTaiwaneseThaiTlingit-HaidaTohono O'OdhamTonganTrinidadian and TobagonianTsimshianTurkishU.S. Virgin IslanderUgandanUkrainianUruguayanUteVenezuelanVietnameseWelshWest IndianYakamaYaquiYugoslavianYumanYup'ikZimbabwean
Immigration
NonimmigrantsImmigrantsAfghanistanAfricaAlbaniaArgentinaArmeniaAsiaAustraliaAustriaBahamasBangladeshBarbadosBelarusBelgiumBelizeBoliviaBosnia and HerzegovinaBrazilBulgariaBurma/MyanmarCabo VerdeCambodiaCameroonCanadaCaribbeanCentral AmericaChileChinaColombiaCongoCosta RicaCroatiaCubaCzechoslovakiaDenmarkDominicaDominican RepublicEastern AfricaEastern AsiaEastern EuropeEcuadorEgyptEl SalvadorEnglandEritreaEthiopiaEuropeFijiFranceGermanyGhanaGreeceGrenadaGuatemalaGuyanaHaitiHondurasHong KongHungaryIndiaIndonesiaIranIraqIrelandIsraelItalyJamaicaJapanJordanKazakhstanKenyaKoreaKuwaitLaosLatin AmericaLatviaLebanonLiberiaLithuaniaMalaysiaMexicoMicronesiaMiddle AfricaMoldovaMoroccoNepalNetherlandsNicaraguaNigeriaNorth AmericaNorth MacedoniaNorthern AfricaNorthern EuropeNorwayOceaniaPakistanPanamaPeruPhilippinesPolandPortugalRomaniaRussiaSaudi ArabiaScotlandSenegalSerbiaSierra LeoneSingaporeSomaliaSouth AfricaSouth AmericaSouth Central AsiaSouth Eastern AsiaSouthern EuropeSpainSri LankaSt. Vincent and the GrenadinesSudanSwedenSwitzerlandSyriaTaiwanThailandTrinidad and TobagoTurkeyUgandaUkraineUruguayUzbekistanVenezuelaVietnamWest IndiesWestern AfricaWestern AsiaWestern EuropeYemenZaireZimbabweAzores
Slavic
Race
Ancestry
AfghanAfricanAlaska NativeAlaskan AthabascanAlbanianAleutAlsatianAmericanApacheArabArapahoArgentineanArmenianAssyrian/Chaldean/SyriacAustralianAustrianBahamianBangladeshiBarbadianBasqueBelgianBelizeanBermudanBhutaneseBlackfeetBolivianBrazilianBritishBritish West IndianBulgarianBurmeseCajunCambodianCanadianCape VerdeanCarpatho RusynCelticCentral AmericanCentral American IndianCherokeeCheyenneChickasawChileanChineseChippewaChoctawColombianColvilleComancheCosta RicanCreeCreekCroatianCrowCubanCypriotCzechCzechoslovakianDanishDelawareDominicanDutchDutch West IndianEastern EuropeanEcuadorianEgyptianEnglishEstonianEthiopianEuropeanFijianFilipinoFinnishFrenchFrench American IndianFrench CanadianGermanGerman RussianGhanaianGreekGuamanian/ChamorroGuatemalanGuyaneseHaitianHmongHonduranHopiHoumaHungarianIcelanderIndian (Asian)IndonesianInupiatIranianIraqiIrishIroquoisIsraeliItalianJamaicanJapaneseJordanianKenyanKiowaKoreanLaotianLatvianLebaneseLiberianLithuanianLumbeeLuxembourgerMacedonianMalaysianMalteseMarshalleseMenomineeMexicanMexican American IndianMongolianMoroccanNative HawaiianNavajoNepaleseNew ZealanderNicaraguanNigerianNorthern EuropeanNorwegianOkinawanOsageOttawaPaiutePakistaniPalestinianPanamanianParaguayanPennsylvania GermanPeruvianPimaPolishPortuguesePotawatomiPuebloPuerto RicanPuget Sound SalishRomanianRussianSalvadoranSamoanScandinavianScotch-IrishScottishSeminoleSenegaleseSerbianShoshoneSierra LeoneanSiouxSlavicSlovakSloveneSomaliSouth AfricanSouth AmericanSouth American IndianSoviet UnionSpaniardSpanishSpanish AmericanSpanish American IndianSri LankanSubsaharan AfricanSudaneseSwedishSwissSyrianTaiwaneseThaiTlingit-HaidaTohono O'OdhamTonganTrinidadian and TobagonianTsimshianTurkishU.S. Virgin IslanderUgandanUkrainianUruguayanUteVenezuelanVietnameseWelshWest IndianYakamaYaquiYugoslavianYumanYup'ikZimbabwean
Immigration
ImmigrantsAfghanistanAfricaAlbaniaArgentinaArmeniaAsiaAustraliaAustriaBahamasBangladeshBarbadosBelarusBelgiumBelizeBoliviaBosnia and HerzegovinaBrazilBulgariaBurma/MyanmarCabo VerdeCambodiaCameroonCanadaCaribbeanCentral AmericaChileChinaColombiaCongoCosta RicaCroatiaCubaCzechoslovakiaDenmarkDominicaDominican RepublicEastern AfricaEastern AsiaEastern EuropeEcuadorEgyptEl SalvadorEnglandEritreaEthiopiaEuropeFijiFranceGermanyGhanaGreeceGrenadaGuatemalaGuyanaHaitiHondurasHong KongHungaryIndiaIndonesiaIranIraqIrelandIsraelItalyJamaicaJapanJordanKazakhstanKenyaKoreaKuwaitLaosLatin AmericaLatviaLebanonLiberiaLithuaniaMalaysiaMexicoMicronesiaMiddle AfricaMoldovaMoroccoNepalNetherlandsNicaraguaNigeriaNorth AmericaNorth MacedoniaNorthern AfricaNorthern EuropeNorwayOceaniaPakistanPanamaPeruPhilippinesPolandPortugalRomaniaRussiaSaudi ArabiaScotlandSenegalSerbiaSierra LeoneSingaporeSomaliaSouth AfricaSouth AmericaSouth Central AsiaSouth Eastern AsiaSouthern EuropeSpainSri LankaSt. Vincent and the GrenadinesSudanSwedenSwitzerlandSyriaTaiwanThailandTrinidad and TobagoTurkeyUgandaUkraineUruguayUzbekistanVenezuelaVietnamWest IndiesWestern AfricaWestern AsiaWestern EuropeYemenZaireZimbabweAzores
Receiving Food Stamps
Income
Poverty
Unemployment
Labor Participation
Family Structure
Vehicle Availability
Education Level
Disability

Receiving Food Stamps Comparison

Nonimmigrants

Slavs

Poor
Exceptional
12.4%
RECEIVING FOOD STAMPS
17.6/ 100
METRIC RATING
204th/ 347
METRIC RANK
10.6%
RECEIVING FOOD STAMPS
93.8/ 100
METRIC RATING
121st/ 347
METRIC RANK

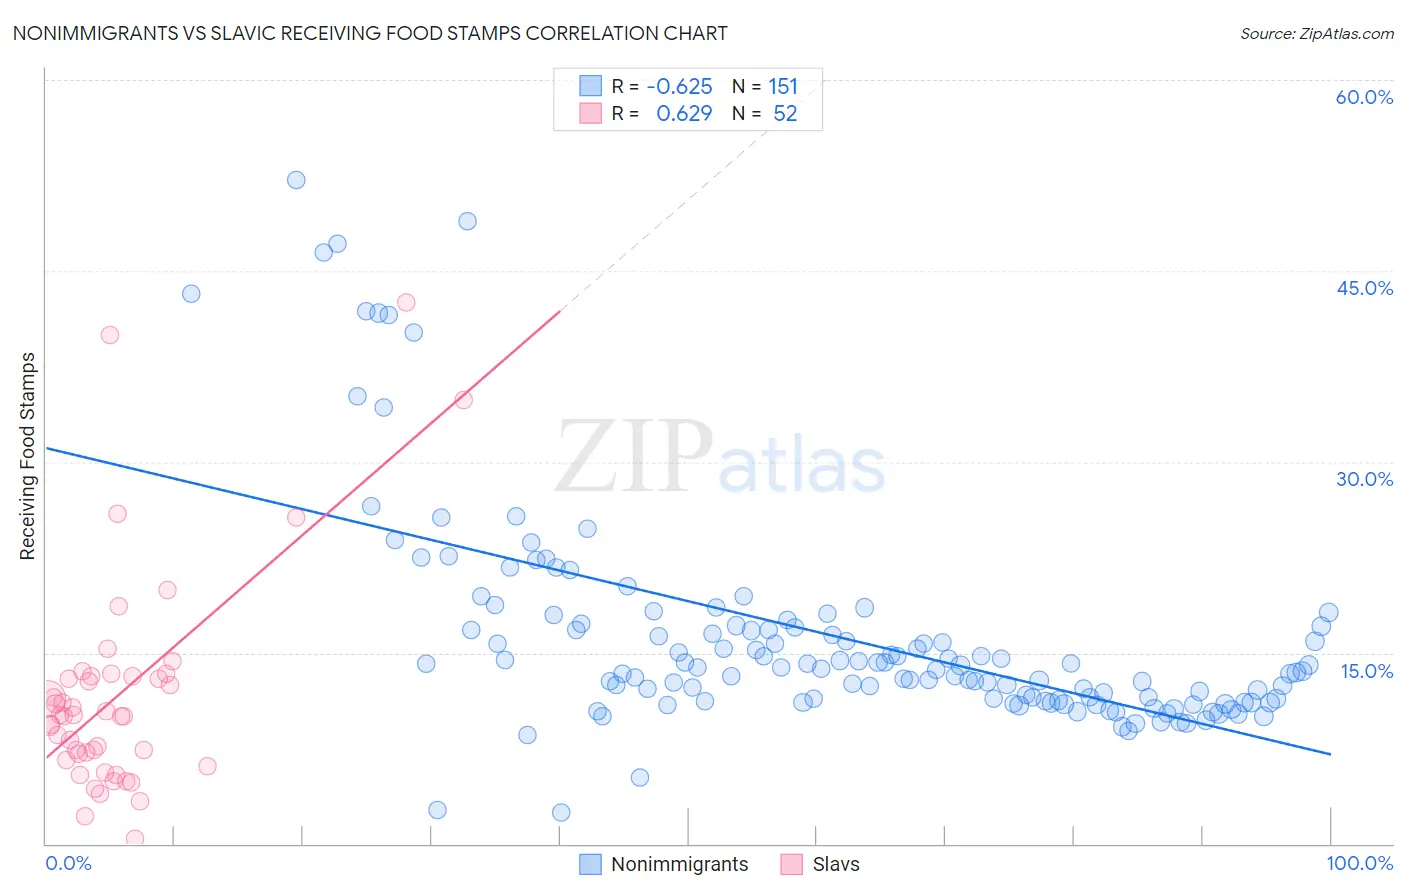
Nonimmigrants vs Slavic Receiving Food Stamps Correlation Chart

The statistical analysis conducted on geographies consisting of 580,622,931 people shows a significant negative correlation between the proportion of Nonimmigrants and percentage of population receiving government assistance and/or food stamps in the United States with a correlation coefficient (R) of -0.625 and weighted average of 12.4%. Similarly, the statistical analysis conducted on geographies consisting of 270,346,460 people shows a significant positive correlation between the proportion of Slavs and percentage of population receiving government assistance and/or food stamps in the United States with a correlation coefficient (R) of 0.629 and weighted average of 10.6%, a difference of 16.5%.
Nonimmigrants vs Slavic Receiving Food Stamps

Receiving Food Stamps Correlation Summary

MeasurementNonimmigrantsSlavic
Minimum2.4%0.40%
Maximum52.1%42.5%
Range49.7%42.1%
Mean16.2%11.7%
Median13.8%10.1%
Interquartile 25% (IQ1)11.2%6.8%
Interquartile 75% (IQ3)17.1%13.2%
Interquartile Range (IQR)5.9%6.4%
Standard Deviation (Sample)8.7%8.5%
Standard Deviation (Population)8.6%8.5%

Similar Demographics by Receiving Food Stamps

Demographics Similar to Nonimmigrants by Receiving Food Stamps

In terms of receiving food stamps, the demographic groups most similar to Nonimmigrants are Shoshone (12.4%, a difference of 0.030%), Aleut (12.4%, a difference of 0.070%), Immigrants from Thailand (12.4%, a difference of 0.13%), South American (12.4%, a difference of 0.39%), and Immigrants from Venezuela (12.3%, a difference of 0.56%).
DemographicsRating | RankReceiving Food Stamps
Delaware
26.1
/100
|
#197
Fair
12.2%
Immigrants | Costa Rica
25.4
/100
|
#198
Fair
12.2%
Portuguese
25.1
/100
|
#199
Fair
12.2%
Sierra Leoneans
23.6
/100
|
#200
Fair
12.2%
Ugandans
22.5
/100
|
#201
Fair
12.2%
Immigrants | Venezuela
20.1
/100
|
#202
Fair
12.3%
Shoshone
17.7
/100
|
#203
Poor
12.4%
Immigrants | Nonimmigrants
17.6
/100
|
#204
Poor
12.4%
Aleuts
17.3
/100
|
#205
Poor
12.4%
Immigrants | Thailand
17.0
/100
|
#206
Poor
12.4%
South Americans
16.0
/100
|
#207
Poor
12.4%
Potawatomi
14.6
/100
|
#208
Poor
12.5%
Immigrants | Sierra Leone
12.9
/100
|
#209
Poor
12.5%
Immigrants | Uruguay
12.8
/100
|
#210
Poor
12.5%
Colombians
10.2
/100
|
#211
Poor
12.6%

Demographics Similar to Slavs by Receiving Food Stamps

In terms of receiving food stamps, the demographic groups most similar to Slavs are Immigrants from Poland (10.6%, a difference of 0.030%), Ethiopian (10.6%, a difference of 0.030%), Sri Lankan (10.6%, a difference of 0.070%), Assyrian/Chaldean/Syriac (10.6%, a difference of 0.20%), and Immigrants from Philippines (10.7%, a difference of 0.33%).
DemographicsRating | RankReceiving Food Stamps
Scotch-Irish
95.1
/100
|
#114
Exceptional
10.5%
Immigrants | Saudi Arabia
94.9
/100
|
#115
Exceptional
10.5%
Canadians
94.8
/100
|
#116
Exceptional
10.5%
Immigrants | Nepal
94.6
/100
|
#117
Exceptional
10.6%
Assyrians/Chaldeans/Syriacs
94.1
/100
|
#118
Exceptional
10.6%
Immigrants | Poland
93.9
/100
|
#119
Exceptional
10.6%
Ethiopians
93.9
/100
|
#120
Exceptional
10.6%
Slavs
93.8
/100
|
#121
Exceptional
10.6%
Sri Lankans
93.7
/100
|
#122
Exceptional
10.6%
Immigrants | Philippines
93.3
/100
|
#123
Exceptional
10.7%
Paraguayans
93.0
/100
|
#124
Exceptional
10.7%
Ukrainians
92.8
/100
|
#125
Exceptional
10.7%
Afghans
92.6
/100
|
#126
Exceptional
10.7%
Immigrants | Ethiopia
92.6
/100
|
#127
Exceptional
10.7%
Immigrants | Jordan
92.5
/100
|
#128
Exceptional
10.7%