Ecuadorian vs Native/Alaskan Receiving Food Stamps
COMPARE
Ecuadorian
Native/Alaskan
Receiving Food Stamps
Receiving Food Stamps Comparison
Ecuadorians
Natives/Alaskans
14.9%
RECEIVING FOOD STAMPS
0.0/ 100
METRIC RATING
280th/ 347
METRIC RANK
17.3%
RECEIVING FOOD STAMPS
0.0/ 100
METRIC RATING
321st/ 347
METRIC RANK
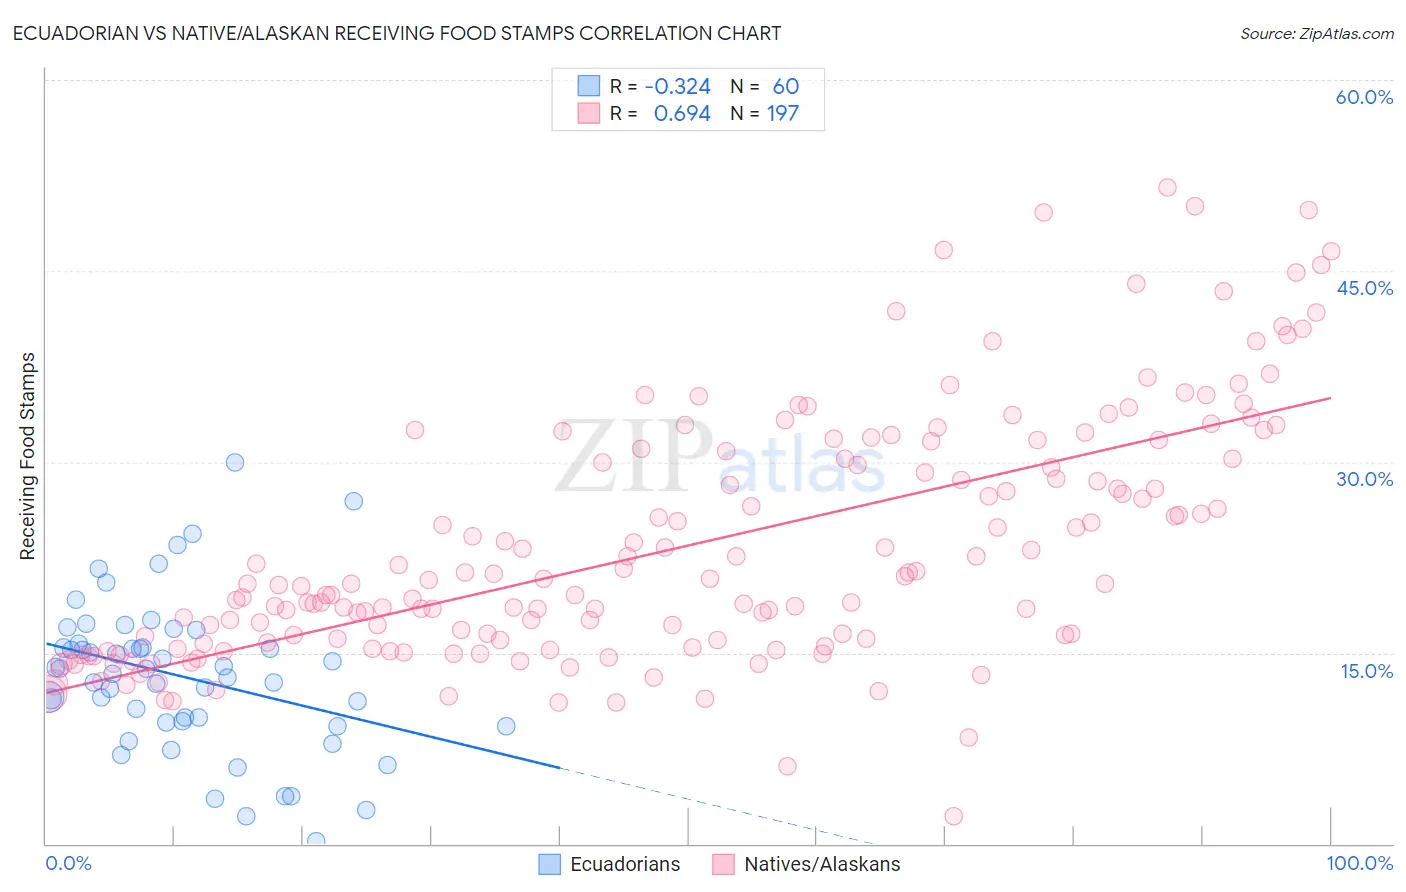
Ecuadorian vs Native/Alaskan Receiving Food Stamps Correlation Chart
The statistical analysis conducted on geographies consisting of 317,062,012 people shows a mild negative correlation between the proportion of Ecuadorians and percentage of population receiving government assistance and/or food stamps in the United States with a correlation coefficient (R) of -0.324 and weighted average of 14.9%. Similarly, the statistical analysis conducted on geographies consisting of 511,480,561 people shows a significant positive correlation between the proportion of Natives/Alaskans and percentage of population receiving government assistance and/or food stamps in the United States with a correlation coefficient (R) of 0.694 and weighted average of 17.3%, a difference of 16.1%.
Receiving Food Stamps Correlation Summary
| Measurement | Ecuadorian | Native/Alaskan |
| Minimum | 0.20% | 2.2% |
| Maximum | 30.0% | 51.6% |
| Range | 29.8% | 49.4% |
| Mean | 13.1% | 23.4% |
| Median | 13.6% | 20.4% |
| Interquartile 25% (IQ1) | 9.6% | 15.8% |
| Interquartile 75% (IQ3) | 15.6% | 30.5% |
| Interquartile Range (IQR) | 6.0% | 14.7% |
| Standard Deviation (Sample) | 5.9% | 9.7% |
| Standard Deviation (Population) | 5.9% | 9.7% |
Similar Demographics by Receiving Food Stamps
Demographics Similar to Ecuadorians by Receiving Food Stamps
In terms of receiving food stamps, the demographic groups most similar to Ecuadorians are Kiowa (14.9%, a difference of 0.050%), Belizean (14.8%, a difference of 0.32%), Spanish American Indian (14.9%, a difference of 0.32%), Seminole (14.8%, a difference of 0.45%), and Liberian (14.8%, a difference of 0.50%).
| Demographics | Rating | Rank | Receiving Food Stamps |
| Alaskan Athabascans | 0.1 /100 | #273 | Tragic 14.7% |
| Immigrants | Western Africa | 0.1 /100 | #274 | Tragic 14.7% |
| Ute | 0.1 /100 | #275 | Tragic 14.7% |
| Liberians | 0.1 /100 | #276 | Tragic 14.8% |
| Seminole | 0.1 /100 | #277 | Tragic 14.8% |
| Belizeans | 0.1 /100 | #278 | Tragic 14.8% |
| Kiowa | 0.0 /100 | #279 | Tragic 14.9% |
| Ecuadorians | 0.0 /100 | #280 | Tragic 14.9% |
| Spanish American Indians | 0.0 /100 | #281 | Tragic 14.9% |
| Immigrants | Central America | 0.0 /100 | #282 | Tragic 15.0% |
| Bangladeshis | 0.0 /100 | #283 | Tragic 15.0% |
| Immigrants | Ecuador | 0.0 /100 | #284 | Tragic 15.0% |
| Immigrants | Liberia | 0.0 /100 | #285 | Tragic 15.1% |
| Africans | 0.0 /100 | #286 | Tragic 15.1% |
| Immigrants | Mexico | 0.0 /100 | #287 | Tragic 15.2% |
Demographics Similar to Natives/Alaskans by Receiving Food Stamps
In terms of receiving food stamps, the demographic groups most similar to Natives/Alaskans are Immigrants from Nicaragua (17.2%, a difference of 0.18%), Immigrants from St. Vincent and the Grenadines (17.2%, a difference of 0.26%), Menominee (17.2%, a difference of 0.44%), Black/African American (17.2%, a difference of 0.62%), and Central American Indian (17.1%, a difference of 1.1%).
| Demographics | Rating | Rank | Receiving Food Stamps |
| Immigrants | Guyana | 0.0 /100 | #314 | Tragic 16.9% |
| Bahamians | 0.0 /100 | #315 | Tragic 17.0% |
| Central American Indians | 0.0 /100 | #316 | Tragic 17.1% |
| Blacks/African Americans | 0.0 /100 | #317 | Tragic 17.2% |
| Menominee | 0.0 /100 | #318 | Tragic 17.2% |
| Immigrants | St. Vincent and the Grenadines | 0.0 /100 | #319 | Tragic 17.2% |
| Immigrants | Nicaragua | 0.0 /100 | #320 | Tragic 17.2% |
| Natives/Alaskans | 0.0 /100 | #321 | Tragic 17.3% |
| Immigrants | Grenada | 0.0 /100 | #322 | Tragic 17.8% |
| Haitians | 0.0 /100 | #323 | Tragic 17.8% |
| British West Indians | 0.0 /100 | #324 | Tragic 17.9% |
| Immigrants | Haiti | 0.0 /100 | #325 | Tragic 18.2% |
| Cubans | 0.0 /100 | #326 | Tragic 18.2% |
| Apache | 0.0 /100 | #327 | Tragic 18.3% |
| Colville | 0.0 /100 | #328 | Tragic 18.3% |