Nonimmigrants vs Immigrants from Sudan 8th Grade
COMPARE
Nonimmigrants
Immigrants from Sudan
8th Grade
8th Grade Comparison
Nonimmigrants
Immigrants from Sudan
96.2%
8TH GRADE
96.0/ 100
METRIC RATING
116th/ 347
METRIC RANK
95.5%
8TH GRADE
15.1/ 100
METRIC RATING
207th/ 347
METRIC RANK
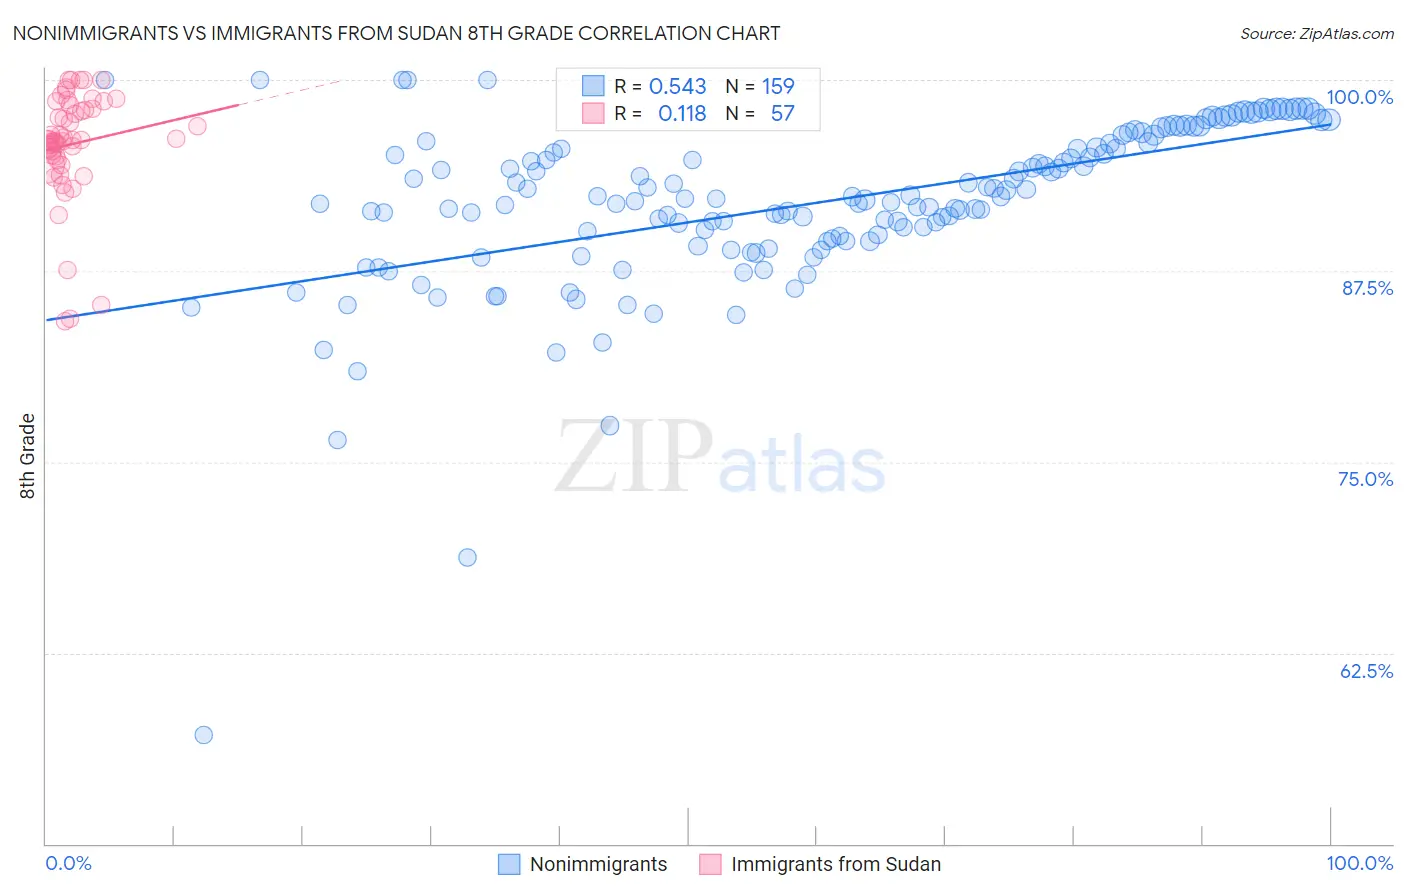
Nonimmigrants vs Immigrants from Sudan 8th Grade Correlation Chart
The statistical analysis conducted on geographies consisting of 585,374,268 people shows a substantial positive correlation between the proportion of Nonimmigrants and percentage of population with at least 8th grade education in the United States with a correlation coefficient (R) of 0.543 and weighted average of 96.2%. Similarly, the statistical analysis conducted on geographies consisting of 118,959,807 people shows a poor positive correlation between the proportion of Immigrants from Sudan and percentage of population with at least 8th grade education in the United States with a correlation coefficient (R) of 0.118 and weighted average of 95.5%, a difference of 0.80%.
8th Grade Correlation Summary
| Measurement | Nonimmigrants | Immigrants from Sudan |
| Minimum | 57.2% | 84.2% |
| Maximum | 100.0% | 100.0% |
| Range | 42.8% | 15.8% |
| Mean | 91.9% | 95.8% |
| Median | 92.2% | 96.1% |
| Interquartile 25% (IQ1) | 89.5% | 94.9% |
| Interquartile 75% (IQ3) | 95.8% | 98.2% |
| Interquartile Range (IQR) | 6.3% | 3.3% |
| Standard Deviation (Sample) | 5.6% | 3.6% |
| Standard Deviation (Population) | 5.6% | 3.5% |
Similar Demographics by 8th Grade
Demographics Similar to Nonimmigrants by 8th Grade
In terms of 8th grade, the demographic groups most similar to Nonimmigrants are Immigrants from Croatia (96.2%, a difference of 0.0%), Immigrants from Norway (96.2%, a difference of 0.010%), Immigrants from Japan (96.2%, a difference of 0.020%), Immigrants from Moldova (96.2%, a difference of 0.020%), and Shoshone (96.3%, a difference of 0.030%).
| Demographics | Rating | Rank | 8th Grade |
| Iroquois | 97.5 /100 | #109 | Exceptional 96.3% |
| Cajuns | 97.1 /100 | #110 | Exceptional 96.3% |
| Shoshone | 96.8 /100 | #111 | Exceptional 96.3% |
| Syrians | 96.7 /100 | #112 | Exceptional 96.3% |
| Immigrants | Zimbabwe | 96.7 /100 | #113 | Exceptional 96.3% |
| Immigrants | Japan | 96.5 /100 | #114 | Exceptional 96.2% |
| Immigrants | Moldova | 96.5 /100 | #115 | Exceptional 96.2% |
| Immigrants | Nonimmigrants | 96.0 /100 | #116 | Exceptional 96.2% |
| Immigrants | Croatia | 96.0 /100 | #117 | Exceptional 96.2% |
| Immigrants | Norway | 95.7 /100 | #118 | Exceptional 96.2% |
| Immigrants | Switzerland | 95.3 /100 | #119 | Exceptional 96.2% |
| Immigrants | France | 95.3 /100 | #120 | Exceptional 96.2% |
| Immigrants | Bulgaria | 95.3 /100 | #121 | Exceptional 96.2% |
| Immigrants | Europe | 95.3 /100 | #122 | Exceptional 96.2% |
| Filipinos | 94.6 /100 | #123 | Exceptional 96.2% |
Demographics Similar to Immigrants from Sudan by 8th Grade
In terms of 8th grade, the demographic groups most similar to Immigrants from Sudan are Portuguese (95.5%, a difference of 0.010%), Hawaiian (95.5%, a difference of 0.020%), Immigrants from Bahamas (95.5%, a difference of 0.020%), Comanche (95.5%, a difference of 0.020%), and Immigrants from Lebanon (95.4%, a difference of 0.020%).
| Demographics | Rating | Rank | 8th Grade |
| Argentineans | 22.2 /100 | #200 | Fair 95.5% |
| Immigrants | Argentina | 20.6 /100 | #201 | Fair 95.5% |
| Apache | 19.4 /100 | #202 | Poor 95.5% |
| Moroccans | 17.4 /100 | #203 | Poor 95.5% |
| Hawaiians | 16.7 /100 | #204 | Poor 95.5% |
| Immigrants | Bahamas | 16.7 /100 | #205 | Poor 95.5% |
| Comanche | 16.3 /100 | #206 | Poor 95.5% |
| Immigrants | Sudan | 15.1 /100 | #207 | Poor 95.5% |
| Portuguese | 14.3 /100 | #208 | Poor 95.5% |
| Immigrants | Lebanon | 13.7 /100 | #209 | Poor 95.4% |
| Africans | 13.6 /100 | #210 | Poor 95.4% |
| Immigrants | Morocco | 12.4 /100 | #211 | Poor 95.4% |
| Immigrants | Pakistan | 9.7 /100 | #212 | Tragic 95.4% |
| Laotians | 9.0 /100 | #213 | Tragic 95.4% |
| Immigrants | Chile | 9.0 /100 | #214 | Tragic 95.4% |