Nonimmigrants vs Immigrants from North Macedonia Female Poverty Among 25-34 Year Olds
COMPARE
Nonimmigrants
Immigrants from North Macedonia
Female Poverty Among 25-34 Year Olds
Female Poverty Among 25-34 Year Olds Comparison
Nonimmigrants
Immigrants from North Macedonia
15.6%
FEMALE POVERTY AMONG 25-34 YEAR OLDS
0.1/ 100
METRIC RATING
273rd/ 347
METRIC RANK
11.8%
FEMALE POVERTY AMONG 25-34 YEAR OLDS
99.8/ 100
METRIC RATING
38th/ 347
METRIC RANK
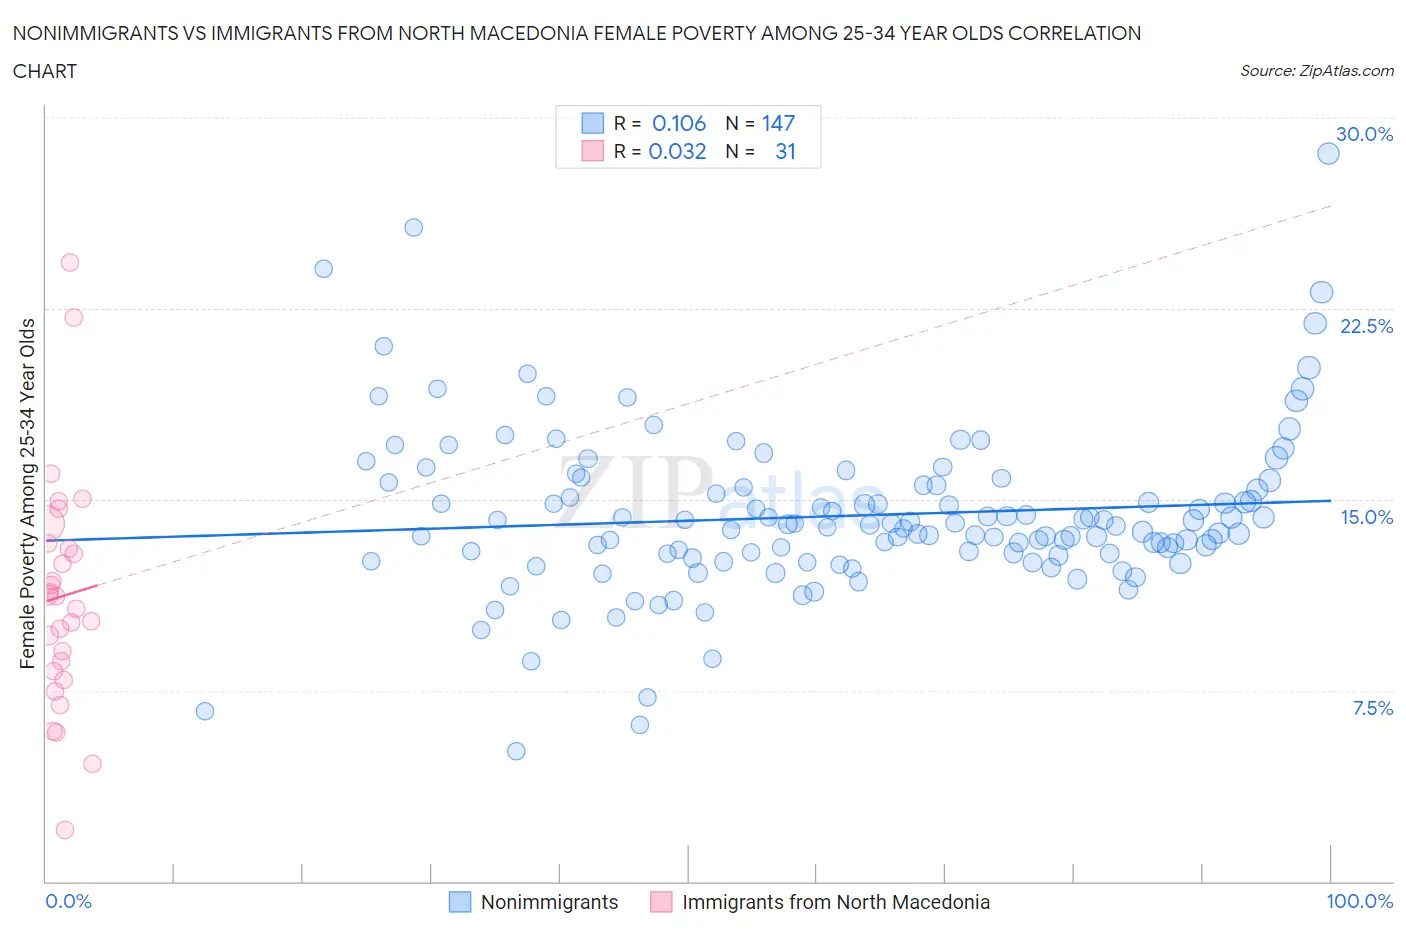
Nonimmigrants vs Immigrants from North Macedonia Female Poverty Among 25-34 Year Olds Correlation Chart
The statistical analysis conducted on geographies consisting of 559,225,521 people shows a poor positive correlation between the proportion of Nonimmigrants and poverty level among females between the ages 25 and 34 in the United States with a correlation coefficient (R) of 0.106 and weighted average of 15.6%. Similarly, the statistical analysis conducted on geographies consisting of 73,602,403 people shows no correlation between the proportion of Immigrants from North Macedonia and poverty level among females between the ages 25 and 34 in the United States with a correlation coefficient (R) of 0.032 and weighted average of 11.8%, a difference of 32.8%.
Female Poverty Among 25-34 Year Olds Correlation Summary
| Measurement | Nonimmigrants | Immigrants from North Macedonia |
| Minimum | 5.1% | 2.0% |
| Maximum | 28.6% | 24.3% |
| Range | 23.5% | 22.3% |
| Mean | 14.4% | 11.2% |
| Median | 14.0% | 11.2% |
| Interquartile 25% (IQ1) | 12.9% | 8.2% |
| Interquartile 75% (IQ3) | 15.5% | 13.3% |
| Interquartile Range (IQR) | 2.7% | 5.0% |
| Standard Deviation (Sample) | 3.2% | 4.6% |
| Standard Deviation (Population) | 3.2% | 4.5% |
Similar Demographics by Female Poverty Among 25-34 Year Olds
Demographics Similar to Nonimmigrants by Female Poverty Among 25-34 Year Olds
In terms of female poverty among 25-34 year olds, the demographic groups most similar to Nonimmigrants are Senegalese (15.6%, a difference of 0.11%), Cree (15.6%, a difference of 0.17%), British West Indian (15.6%, a difference of 0.18%), Subsaharan African (15.6%, a difference of 0.33%), and Immigrants from Caribbean (15.7%, a difference of 0.49%).
| Demographics | Rating | Rank | Female Poverty Among 25-34 Year Olds |
| Immigrants | Somalia | 0.1 /100 | #266 | Tragic 15.4% |
| Central Americans | 0.1 /100 | #267 | Tragic 15.5% |
| Immigrants | Senegal | 0.1 /100 | #268 | Tragic 15.6% |
| Sub-Saharan Africans | 0.1 /100 | #269 | Tragic 15.6% |
| British West Indians | 0.1 /100 | #270 | Tragic 15.6% |
| Cree | 0.1 /100 | #271 | Tragic 15.6% |
| Senegalese | 0.1 /100 | #272 | Tragic 15.6% |
| Immigrants | Nonimmigrants | 0.1 /100 | #273 | Tragic 15.6% |
| Immigrants | Caribbean | 0.0 /100 | #274 | Tragic 15.7% |
| Immigrants | Azores | 0.0 /100 | #275 | Tragic 15.8% |
| Immigrants | Zaire | 0.0 /100 | #276 | Tragic 15.8% |
| Immigrants | Micronesia | 0.0 /100 | #277 | Tragic 15.8% |
| French American Indians | 0.0 /100 | #278 | Tragic 15.9% |
| Fijians | 0.0 /100 | #279 | Tragic 15.9% |
| Bangladeshis | 0.0 /100 | #280 | Tragic 15.9% |
Demographics Similar to Immigrants from North Macedonia by Female Poverty Among 25-34 Year Olds
In terms of female poverty among 25-34 year olds, the demographic groups most similar to Immigrants from North Macedonia are Taiwanese (11.8%, a difference of 0.070%), Immigrants from Sri Lanka (11.8%, a difference of 0.23%), Latvian (11.8%, a difference of 0.25%), Immigrants from Bulgaria (11.8%, a difference of 0.41%), and Immigrants from Indonesia (11.8%, a difference of 0.54%).
| Demographics | Rating | Rank | Female Poverty Among 25-34 Year Olds |
| Immigrants | Japan | 99.9 /100 | #31 | Exceptional 11.6% |
| Immigrants | Asia | 99.9 /100 | #32 | Exceptional 11.6% |
| Immigrants | Poland | 99.9 /100 | #33 | Exceptional 11.6% |
| Zimbabweans | 99.9 /100 | #34 | Exceptional 11.7% |
| Cambodians | 99.9 /100 | #35 | Exceptional 11.7% |
| Immigrants | Sri Lanka | 99.8 /100 | #36 | Exceptional 11.8% |
| Taiwanese | 99.8 /100 | #37 | Exceptional 11.8% |
| Immigrants | North Macedonia | 99.8 /100 | #38 | Exceptional 11.8% |
| Latvians | 99.8 /100 | #39 | Exceptional 11.8% |
| Immigrants | Bulgaria | 99.8 /100 | #40 | Exceptional 11.8% |
| Immigrants | Indonesia | 99.8 /100 | #41 | Exceptional 11.8% |
| Immigrants | Turkey | 99.7 /100 | #42 | Exceptional 11.9% |
| Egyptians | 99.7 /100 | #43 | Exceptional 11.9% |
| Immigrants | Australia | 99.7 /100 | #44 | Exceptional 11.9% |
| Macedonians | 99.7 /100 | #45 | Exceptional 11.9% |