Nigerian vs Immigrants from Chile Master's Degree
COMPARE
Nigerian
Immigrants from Chile
Master's Degree
Master's Degree Comparison
Nigerians
Immigrants from Chile
14.9%
MASTER'S DEGREE
48.6/ 100
METRIC RATING
176th/ 347
METRIC RANK
16.8%
MASTER'S DEGREE
98.0/ 100
METRIC RATING
110th/ 347
METRIC RANK
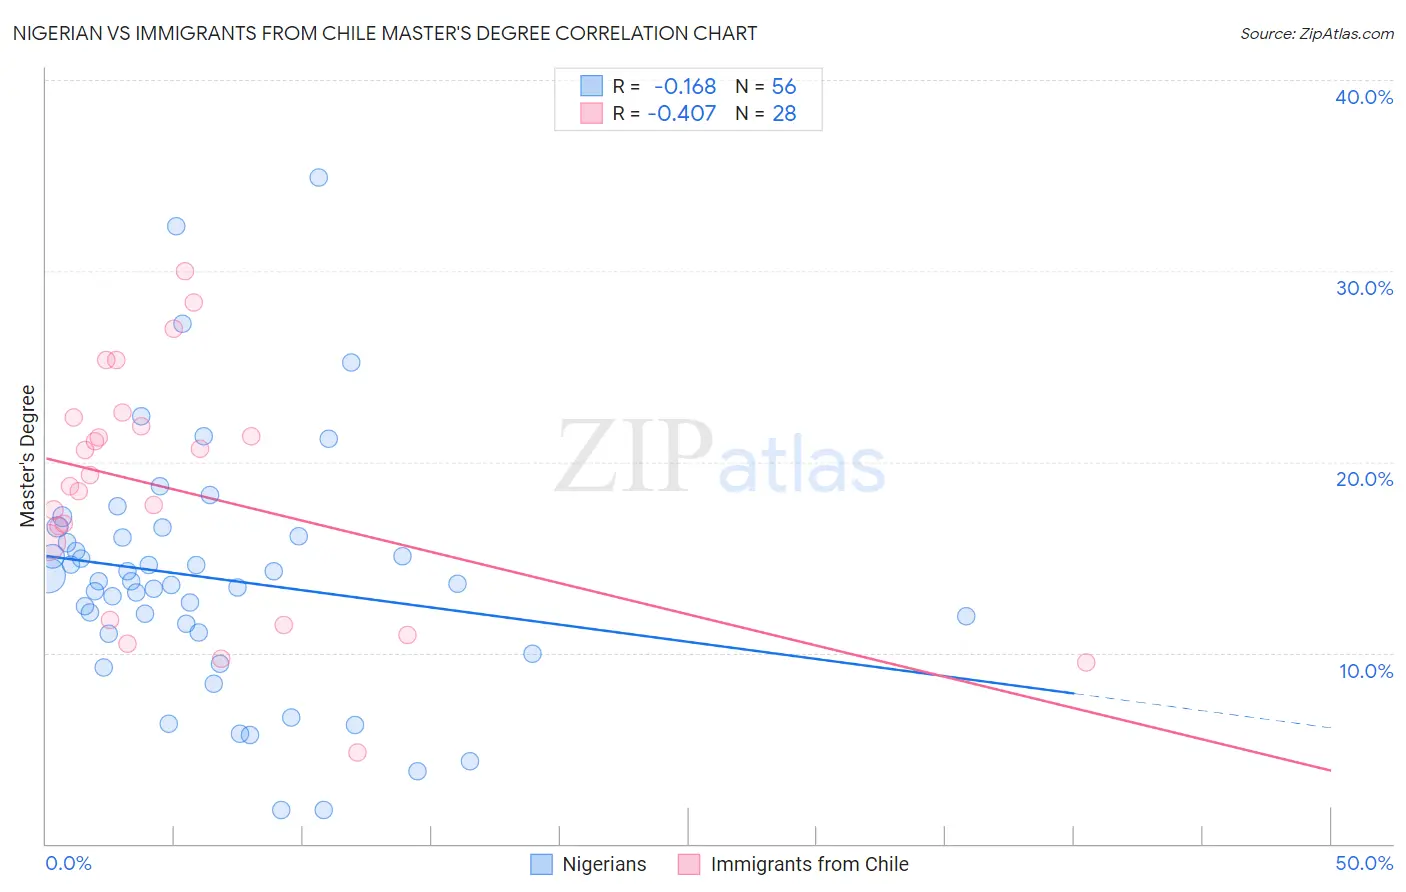
Nigerian vs Immigrants from Chile Master's Degree Correlation Chart
The statistical analysis conducted on geographies consisting of 332,630,518 people shows a poor negative correlation between the proportion of Nigerians and percentage of population with at least master's degree education in the United States with a correlation coefficient (R) of -0.168 and weighted average of 14.9%. Similarly, the statistical analysis conducted on geographies consisting of 218,626,244 people shows a moderate negative correlation between the proportion of Immigrants from Chile and percentage of population with at least master's degree education in the United States with a correlation coefficient (R) of -0.407 and weighted average of 16.8%, a difference of 12.6%.
Master's Degree Correlation Summary
| Measurement | Nigerian | Immigrants from Chile |
| Minimum | 1.8% | 4.8% |
| Maximum | 34.9% | 30.0% |
| Range | 33.2% | 25.2% |
| Mean | 13.9% | 18.5% |
| Median | 13.7% | 19.0% |
| Interquartile 25% (IQ1) | 11.0% | 13.8% |
| Interquartile 75% (IQ3) | 16.1% | 22.1% |
| Interquartile Range (IQR) | 5.0% | 8.3% |
| Standard Deviation (Sample) | 6.5% | 6.2% |
| Standard Deviation (Population) | 6.4% | 6.1% |
Similar Demographics by Master's Degree
Demographics Similar to Nigerians by Master's Degree
In terms of master's degree, the demographic groups most similar to Nigerians are Immigrants from Colombia (14.9%, a difference of 0.030%), Immigrants from Peru (14.9%, a difference of 0.14%), Slovak (14.9%, a difference of 0.18%), English (14.8%, a difference of 0.47%), and Costa Rican (15.0%, a difference of 0.50%).
| Demographics | Rating | Rank | Master's Degree |
| Scottish | 62.7 /100 | #169 | Good 15.2% |
| Irish | 56.3 /100 | #170 | Average 15.0% |
| Immigrants | Ghana | 53.6 /100 | #171 | Average 15.0% |
| Immigrants | Uruguay | 52.8 /100 | #172 | Average 15.0% |
| Costa Ricans | 52.5 /100 | #173 | Average 15.0% |
| Slovaks | 50.0 /100 | #174 | Average 14.9% |
| Immigrants | Peru | 49.6 /100 | #175 | Average 14.9% |
| Nigerians | 48.6 /100 | #176 | Average 14.9% |
| Immigrants | Colombia | 48.3 /100 | #177 | Average 14.9% |
| English | 45.0 /100 | #178 | Average 14.8% |
| Immigrants | Iraq | 41.3 /100 | #179 | Average 14.8% |
| Celtics | 41.3 /100 | #180 | Average 14.8% |
| Swiss | 41.1 /100 | #181 | Average 14.7% |
| Czechs | 40.4 /100 | #182 | Average 14.7% |
| Sri Lankans | 39.6 /100 | #183 | Fair 14.7% |
Demographics Similar to Immigrants from Chile by Master's Degree
In terms of master's degree, the demographic groups most similar to Immigrants from Chile are Moroccan (16.8%, a difference of 0.030%), Sierra Leonean (16.8%, a difference of 0.050%), Armenian (16.8%, a difference of 0.080%), Immigrants from Albania (16.8%, a difference of 0.17%), and Austrian (16.7%, a difference of 0.27%).
| Demographics | Rating | Rank | Master's Degree |
| Alsatians | 98.4 /100 | #103 | Exceptional 16.9% |
| Ukrainians | 98.3 /100 | #104 | Exceptional 16.9% |
| Syrians | 98.3 /100 | #105 | Exceptional 16.8% |
| Immigrants | Albania | 98.1 /100 | #106 | Exceptional 16.8% |
| Armenians | 98.0 /100 | #107 | Exceptional 16.8% |
| Sierra Leoneans | 98.0 /100 | #108 | Exceptional 16.8% |
| Moroccans | 98.0 /100 | #109 | Exceptional 16.8% |
| Immigrants | Chile | 98.0 /100 | #110 | Exceptional 16.8% |
| Austrians | 97.8 /100 | #111 | Exceptional 16.7% |
| Macedonians | 97.7 /100 | #112 | Exceptional 16.7% |
| Arabs | 97.7 /100 | #113 | Exceptional 16.7% |
| Northern Europeans | 97.6 /100 | #114 | Exceptional 16.7% |
| Immigrants | Uganda | 97.3 /100 | #115 | Exceptional 16.6% |
| Immigrants | Southern Europe | 97.2 /100 | #116 | Exceptional 16.6% |
| Immigrants | Moldova | 97.2 /100 | #117 | Exceptional 16.6% |