Nigerian vs Immigrants from Chile Births to Unmarried Women
COMPARE
Nigerian
Immigrants from Chile
Births to Unmarried Women
Births to Unmarried Women Comparison
Nigerians
Immigrants from Chile
35.3%
BIRTHS TO UNMARRIED WOMEN
0.7/ 100
METRIC RATING
246th/ 347
METRIC RANK
31.2%
BIRTHS TO UNMARRIED WOMEN
65.7/ 100
METRIC RATING
163rd/ 347
METRIC RANK
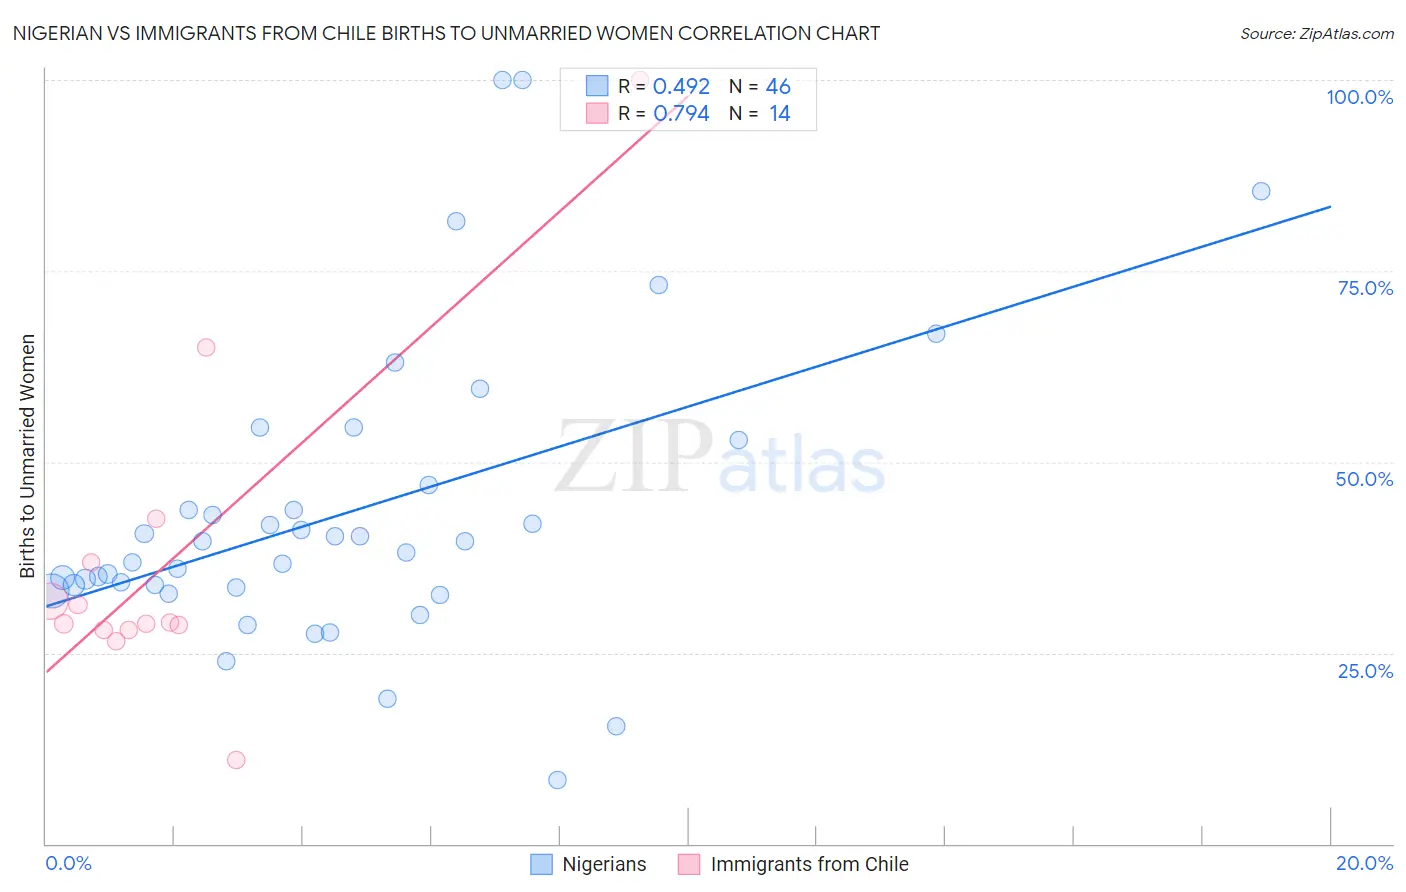
Nigerian vs Immigrants from Chile Births to Unmarried Women Correlation Chart
The statistical analysis conducted on geographies consisting of 318,352,588 people shows a moderate positive correlation between the proportion of Nigerians and percentage of births to unmarried women in the United States with a correlation coefficient (R) of 0.492 and weighted average of 35.3%. Similarly, the statistical analysis conducted on geographies consisting of 209,837,772 people shows a strong positive correlation between the proportion of Immigrants from Chile and percentage of births to unmarried women in the United States with a correlation coefficient (R) of 0.794 and weighted average of 31.2%, a difference of 13.3%.
Births to Unmarried Women Correlation Summary
| Measurement | Nigerian | Immigrants from Chile |
| Minimum | 8.3% | 10.9% |
| Maximum | 100.0% | 100.0% |
| Range | 91.7% | 89.1% |
| Mean | 43.4% | 36.8% |
| Median | 38.8% | 28.9% |
| Interquartile 25% (IQ1) | 33.6% | 28.0% |
| Interquartile 75% (IQ3) | 46.9% | 36.8% |
| Interquartile Range (IQR) | 13.3% | 8.9% |
| Standard Deviation (Sample) | 19.5% | 21.6% |
| Standard Deviation (Population) | 19.3% | 20.8% |
Similar Demographics by Births to Unmarried Women
Demographics Similar to Nigerians by Births to Unmarried Women
In terms of births to unmarried women, the demographic groups most similar to Nigerians are Shoshone (35.3%, a difference of 0.11%), Immigrants from Nigeria (35.4%, a difference of 0.21%), Guyanese (35.2%, a difference of 0.45%), Japanese (35.2%, a difference of 0.51%), and Nonimmigrants (35.5%, a difference of 0.54%).
| Demographics | Rating | Rank | Births to Unmarried Women |
| Sierra Leoneans | 1.4 /100 | #239 | Tragic 34.9% |
| Immigrants | Middle Africa | 1.2 /100 | #240 | Tragic 34.9% |
| Immigrants | Guyana | 1.2 /100 | #241 | Tragic 35.0% |
| Indonesians | 1.2 /100 | #242 | Tragic 35.0% |
| Japanese | 0.9 /100 | #243 | Tragic 35.2% |
| Guyanese | 0.9 /100 | #244 | Tragic 35.2% |
| Shoshone | 0.8 /100 | #245 | Tragic 35.3% |
| Nigerians | 0.7 /100 | #246 | Tragic 35.3% |
| Immigrants | Nigeria | 0.7 /100 | #247 | Tragic 35.4% |
| Immigrants | Nonimmigrants | 0.6 /100 | #248 | Tragic 35.5% |
| Bermudans | 0.6 /100 | #249 | Tragic 35.5% |
| Mexican American Indians | 0.4 /100 | #250 | Tragic 35.7% |
| Immigrants | Western Africa | 0.3 /100 | #251 | Tragic 36.0% |
| Salvadorans | 0.3 /100 | #252 | Tragic 36.0% |
| Immigrants | Portugal | 0.2 /100 | #253 | Tragic 36.2% |
Demographics Similar to Immigrants from Chile by Births to Unmarried Women
In terms of births to unmarried women, the demographic groups most similar to Immigrants from Chile are Slovene (31.2%, a difference of 0.020%), Hungarian (31.2%, a difference of 0.17%), Immigrants from Southern Europe (31.1%, a difference of 0.33%), Immigrants from England (31.1%, a difference of 0.40%), and Immigrants from Western Europe (31.1%, a difference of 0.40%).
| Demographics | Rating | Rank | Births to Unmarried Women |
| Carpatho Rusyns | 73.5 /100 | #156 | Good 30.9% |
| Immigrants | Eastern Africa | 72.1 /100 | #157 | Good 31.0% |
| Austrians | 69.9 /100 | #158 | Good 31.0% |
| Immigrants | England | 69.4 /100 | #159 | Good 31.1% |
| Immigrants | Western Europe | 69.3 /100 | #160 | Good 31.1% |
| Immigrants | Southern Europe | 68.7 /100 | #161 | Good 31.1% |
| Slovenes | 65.9 /100 | #162 | Good 31.2% |
| Immigrants | Chile | 65.7 /100 | #163 | Good 31.2% |
| Hungarians | 64.1 /100 | #164 | Good 31.2% |
| Immigrants | Somalia | 58.1 /100 | #165 | Average 31.4% |
| Peruvians | 55.5 /100 | #166 | Average 31.5% |
| Dutch | 55.3 /100 | #167 | Average 31.5% |
| Belgians | 52.4 /100 | #168 | Average 31.6% |
| Slavs | 52.0 /100 | #169 | Average 31.6% |
| Guamanians/Chamorros | 51.3 /100 | #170 | Average 31.6% |