Nigerian vs Immigrants from Grenada Seniors Poverty Over the Age of 65
COMPARE
Nigerian
Immigrants from Grenada
Seniors Poverty Over the Age of 65
Seniors Poverty Over the Age of 65 Comparison
Nigerians
Immigrants from Grenada
11.8%
SENIORS POVERTY OVER THE AGE OF 65
3.2/ 100
METRIC RATING
227th/ 347
METRIC RANK
15.8%
SENIORS POVERTY OVER THE AGE OF 65
0.0/ 100
METRIC RATING
332nd/ 347
METRIC RANK
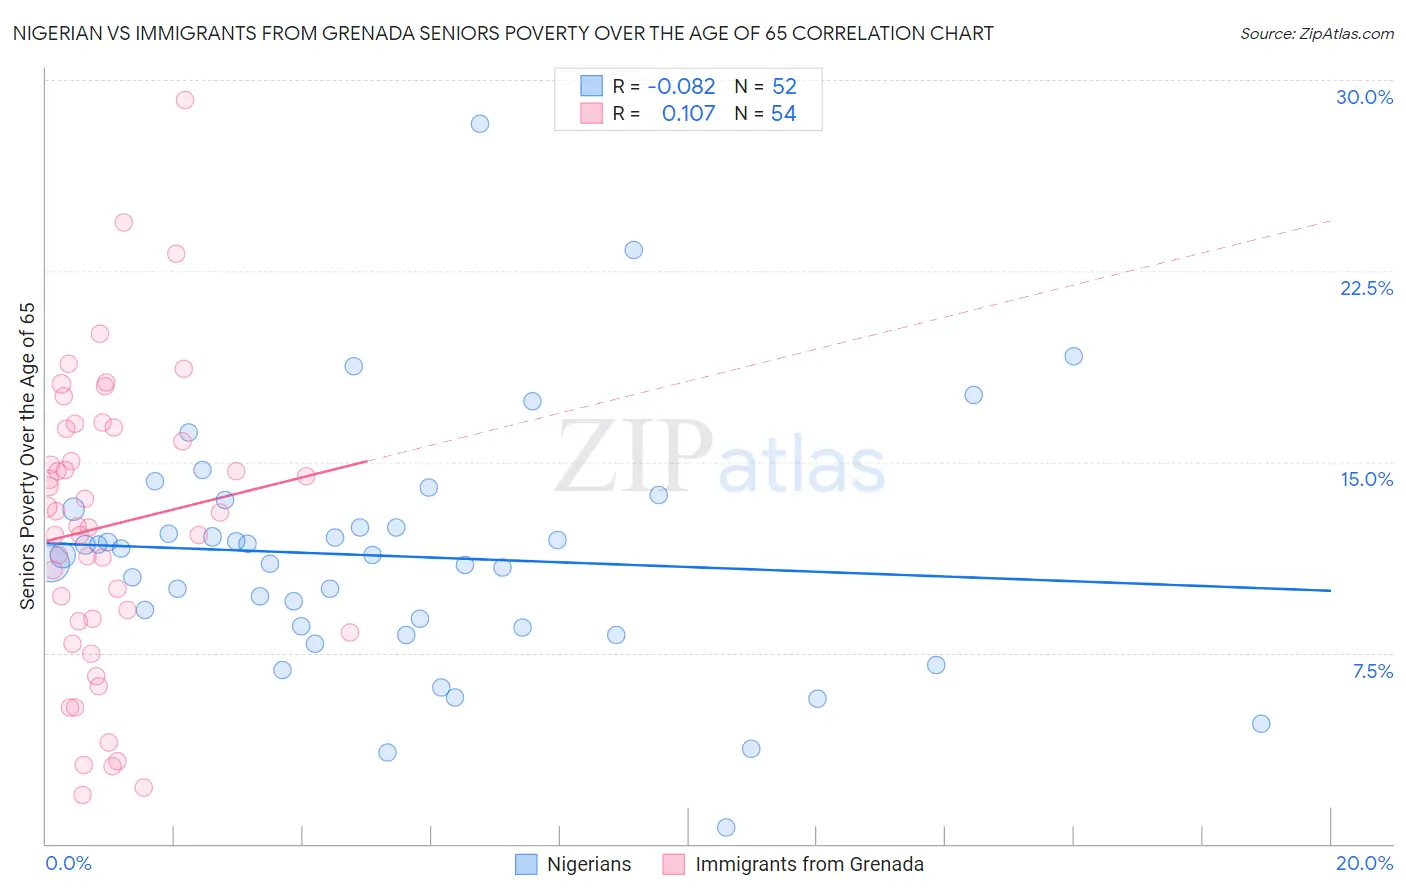
Nigerian vs Immigrants from Grenada Seniors Poverty Over the Age of 65 Correlation Chart
The statistical analysis conducted on geographies consisting of 331,610,759 people shows a slight negative correlation between the proportion of Nigerians and poverty level among seniors over the age of 65 in the United States with a correlation coefficient (R) of -0.082 and weighted average of 11.8%. Similarly, the statistical analysis conducted on geographies consisting of 67,080,367 people shows a poor positive correlation between the proportion of Immigrants from Grenada and poverty level among seniors over the age of 65 in the United States with a correlation coefficient (R) of 0.107 and weighted average of 15.8%, a difference of 34.4%.
Seniors Poverty Over the Age of 65 Correlation Summary
| Measurement | Nigerian | Immigrants from Grenada |
| Minimum | 0.63% | 1.9% |
| Maximum | 28.3% | 29.2% |
| Range | 27.7% | 27.3% |
| Mean | 11.3% | 12.5% |
| Median | 11.3% | 12.7% |
| Interquartile 25% (IQ1) | 8.5% | 8.7% |
| Interquartile 75% (IQ3) | 12.8% | 16.3% |
| Interquartile Range (IQR) | 4.3% | 7.6% |
| Standard Deviation (Sample) | 4.8% | 5.8% |
| Standard Deviation (Population) | 4.7% | 5.7% |
Similar Demographics by Seniors Poverty Over the Age of 65
Demographics Similar to Nigerians by Seniors Poverty Over the Age of 65
In terms of seniors poverty over the age of 65, the demographic groups most similar to Nigerians are Liberian (11.8%, a difference of 0.030%), Immigrants from Belarus (11.8%, a difference of 0.060%), Immigrants from Nigeria (11.7%, a difference of 0.16%), Immigrants from Costa Rica (11.8%, a difference of 0.33%), and Immigrants from Congo (11.7%, a difference of 0.39%).
| Demographics | Rating | Rank | Seniors Poverty Over the Age of 65 |
| Peruvians | 4.2 /100 | #220 | Tragic 11.7% |
| Argentineans | 4.1 /100 | #221 | Tragic 11.7% |
| Immigrants | Chile | 3.9 /100 | #222 | Tragic 11.7% |
| Immigrants | Congo | 3.8 /100 | #223 | Tragic 11.7% |
| Immigrants | Nigeria | 3.4 /100 | #224 | Tragic 11.7% |
| Immigrants | Belarus | 3.2 /100 | #225 | Tragic 11.8% |
| Liberians | 3.2 /100 | #226 | Tragic 11.8% |
| Nigerians | 3.2 /100 | #227 | Tragic 11.8% |
| Immigrants | Costa Rica | 2.7 /100 | #228 | Tragic 11.8% |
| Immigrants | Eritrea | 2.6 /100 | #229 | Tragic 11.8% |
| Bermudans | 2.1 /100 | #230 | Tragic 11.9% |
| Cajuns | 2.0 /100 | #231 | Tragic 11.9% |
| Yaqui | 1.9 /100 | #232 | Tragic 11.9% |
| Panamanians | 1.8 /100 | #233 | Tragic 11.9% |
| Iroquois | 1.7 /100 | #234 | Tragic 11.9% |
Demographics Similar to Immigrants from Grenada by Seniors Poverty Over the Age of 65
In terms of seniors poverty over the age of 65, the demographic groups most similar to Immigrants from Grenada are Immigrants from Yemen (15.9%, a difference of 0.44%), Immigrants from Nicaragua (15.9%, a difference of 0.58%), British West Indian (15.6%, a difference of 1.4%), Cuban (16.1%, a difference of 1.9%), and Immigrants from St. Vincent and the Grenadines (15.5%, a difference of 1.9%).
| Demographics | Rating | Rank | Seniors Poverty Over the Age of 65 |
| Central American Indians | 0.0 /100 | #325 | Tragic 15.1% |
| Immigrants | Armenia | 0.0 /100 | #326 | Tragic 15.2% |
| Crow | 0.0 /100 | #327 | Tragic 15.2% |
| Sioux | 0.0 /100 | #328 | Tragic 15.3% |
| Immigrants | Dominica | 0.0 /100 | #329 | Tragic 15.5% |
| Immigrants | St. Vincent and the Grenadines | 0.0 /100 | #330 | Tragic 15.5% |
| British West Indians | 0.0 /100 | #331 | Tragic 15.6% |
| Immigrants | Grenada | 0.0 /100 | #332 | Tragic 15.8% |
| Immigrants | Yemen | 0.0 /100 | #333 | Tragic 15.9% |
| Immigrants | Nicaragua | 0.0 /100 | #334 | Tragic 15.9% |
| Cubans | 0.0 /100 | #335 | Tragic 16.1% |
| Immigrants | Cabo Verde | 0.0 /100 | #336 | Tragic 16.2% |
| Immigrants | Caribbean | 0.0 /100 | #337 | Tragic 16.5% |
| Pueblo | 0.0 /100 | #338 | Tragic 17.2% |
| Navajo | 0.0 /100 | #339 | Tragic 17.5% |