Immigrants from Afghanistan vs Immigrants from Pakistan Female Poverty Among 18-24 Year Olds
COMPARE
Immigrants from Afghanistan
Immigrants from Pakistan
Female Poverty Among 18-24 Year Olds
Female Poverty Among 18-24 Year Olds Comparison
Immigrants from Afghanistan
Immigrants from Pakistan
19.1%
FEMALE POVERTY AMONG 18-24 YEAR OLDS
98.0/ 100
METRIC RATING
104th/ 347
METRIC RANK
17.0%
FEMALE POVERTY AMONG 18-24 YEAR OLDS
100.0/ 100
METRIC RATING
12th/ 347
METRIC RANK
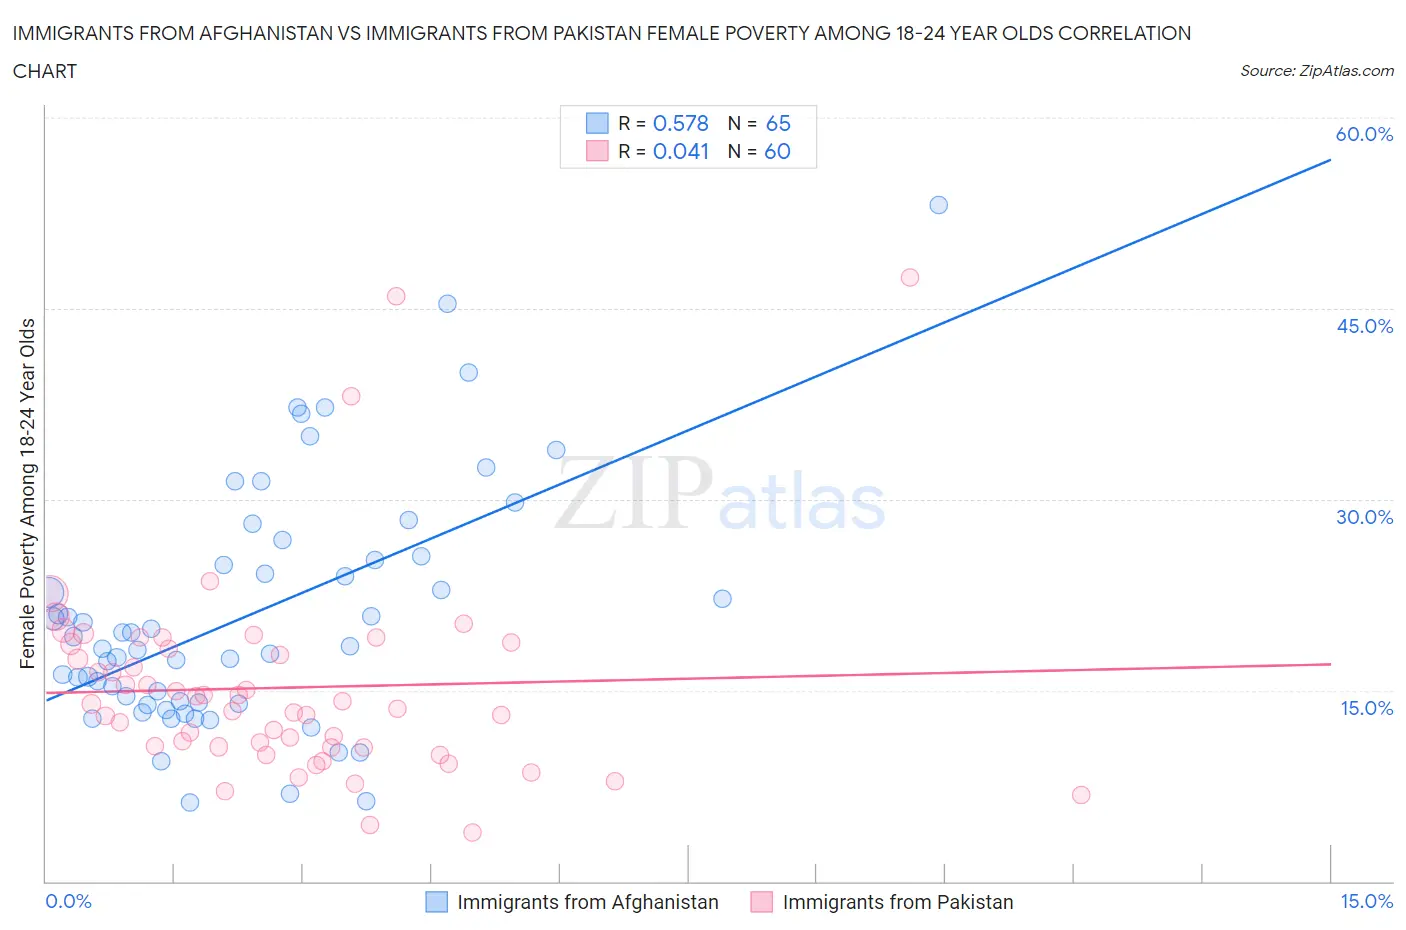
Immigrants from Afghanistan vs Immigrants from Pakistan Female Poverty Among 18-24 Year Olds Correlation Chart
The statistical analysis conducted on geographies consisting of 146,633,346 people shows a substantial positive correlation between the proportion of Immigrants from Afghanistan and poverty level among females between the ages 18 and 24 in the United States with a correlation coefficient (R) of 0.578 and weighted average of 19.1%. Similarly, the statistical analysis conducted on geographies consisting of 279,566,412 people shows no correlation between the proportion of Immigrants from Pakistan and poverty level among females between the ages 18 and 24 in the United States with a correlation coefficient (R) of 0.041 and weighted average of 17.0%, a difference of 12.7%.
Female Poverty Among 18-24 Year Olds Correlation Summary
| Measurement | Immigrants from Afghanistan | Immigrants from Pakistan |
| Minimum | 6.2% | 3.8% |
| Maximum | 53.1% | 47.5% |
| Range | 46.9% | 43.6% |
| Mean | 20.9% | 15.2% |
| Median | 18.4% | 13.7% |
| Interquartile 25% (IQ1) | 14.0% | 10.5% |
| Interquartile 75% (IQ3) | 25.4% | 18.5% |
| Interquartile Range (IQR) | 11.4% | 7.9% |
| Standard Deviation (Sample) | 9.5% | 8.0% |
| Standard Deviation (Population) | 9.4% | 8.0% |
Similar Demographics by Female Poverty Among 18-24 Year Olds
Demographics Similar to Immigrants from Afghanistan by Female Poverty Among 18-24 Year Olds
In terms of female poverty among 18-24 year olds, the demographic groups most similar to Immigrants from Afghanistan are Serbian (19.1%, a difference of 0.040%), Immigrants from Caribbean (19.1%, a difference of 0.080%), Immigrants from Ecuador (19.2%, a difference of 0.090%), Ecuadorian (19.1%, a difference of 0.11%), and Immigrants from Sierra Leone (19.2%, a difference of 0.12%).
| Demographics | Rating | Rank | Female Poverty Among 18-24 Year Olds |
| Salvadorans | 98.4 /100 | #97 | Exceptional 19.1% |
| Immigrants | Jordan | 98.4 /100 | #98 | Exceptional 19.1% |
| Immigrants | Czechoslovakia | 98.3 /100 | #99 | Exceptional 19.1% |
| Chileans | 98.3 /100 | #100 | Exceptional 19.1% |
| Ecuadorians | 98.1 /100 | #101 | Exceptional 19.1% |
| Immigrants | Caribbean | 98.1 /100 | #102 | Exceptional 19.1% |
| Serbians | 98.0 /100 | #103 | Exceptional 19.1% |
| Immigrants | Afghanistan | 98.0 /100 | #104 | Exceptional 19.1% |
| Immigrants | Ecuador | 97.8 /100 | #105 | Exceptional 19.2% |
| Immigrants | Sierra Leone | 97.8 /100 | #106 | Exceptional 19.2% |
| Immigrants | Sri Lanka | 97.5 /100 | #107 | Exceptional 19.2% |
| Immigrants | Uzbekistan | 97.3 /100 | #108 | Exceptional 19.2% |
| Immigrants | Syria | 97.2 /100 | #109 | Exceptional 19.2% |
| Laotians | 97.1 /100 | #110 | Exceptional 19.2% |
| Immigrants | Serbia | 97.1 /100 | #111 | Exceptional 19.2% |
Demographics Similar to Immigrants from Pakistan by Female Poverty Among 18-24 Year Olds
In terms of female poverty among 18-24 year olds, the demographic groups most similar to Immigrants from Pakistan are Thai (17.0%, a difference of 0.090%), Korean (16.9%, a difference of 0.36%), Immigrants from Poland (17.1%, a difference of 0.66%), Immigrants from Peru (16.9%, a difference of 0.72%), and Tongan (17.1%, a difference of 0.83%).
| Demographics | Rating | Rank | Female Poverty Among 18-24 Year Olds |
| Immigrants | Portugal | 100.0 /100 | #5 | Exceptional 16.5% |
| Immigrants | Philippines | 100.0 /100 | #6 | Exceptional 16.7% |
| Immigrants | Azores | 100.0 /100 | #7 | Exceptional 16.7% |
| Immigrants | Bolivia | 100.0 /100 | #8 | Exceptional 16.7% |
| Immigrants | Peru | 100.0 /100 | #9 | Exceptional 16.9% |
| Koreans | 100.0 /100 | #10 | Exceptional 16.9% |
| Thais | 100.0 /100 | #11 | Exceptional 17.0% |
| Immigrants | Pakistan | 100.0 /100 | #12 | Exceptional 17.0% |
| Immigrants | Poland | 100.0 /100 | #13 | Exceptional 17.1% |
| Tongans | 100.0 /100 | #14 | Exceptional 17.1% |
| Cubans | 100.0 /100 | #15 | Exceptional 17.2% |
| Peruvians | 100.0 /100 | #16 | Exceptional 17.2% |
| Immigrants | Taiwan | 100.0 /100 | #17 | Exceptional 17.3% |
| Immigrants | Colombia | 100.0 /100 | #18 | Exceptional 17.3% |
| Immigrants | Lithuania | 100.0 /100 | #19 | Exceptional 17.4% |