Nonimmigrants vs Immigrants from Pakistan Female Poverty Among 18-24 Year Olds

COMPARE

Nonimmigrants
Race
Ancestry
AfghanAfricanAlaska NativeAlaskan AthabascanAlbanianAleutAlsatianAmericanApacheArabArapahoArgentineanArmenianAssyrian/Chaldean/SyriacAustralianAustrianBahamianBangladeshiBarbadianBasqueBelgianBelizeanBermudanBhutaneseBlackfeetBolivianBrazilianBritishBritish West IndianBulgarianBurmeseCajunCambodianCanadianCape VerdeanCarpatho RusynCelticCentral AmericanCentral American IndianCherokeeCheyenneChickasawChileanChineseChippewaChoctawColombianColvilleComancheCosta RicanCreeCreekCroatianCrowCubanCypriotCzechCzechoslovakianDanishDelawareDominicanDutchDutch West IndianEastern EuropeanEcuadorianEgyptianEnglishEstonianEthiopianEuropeanFijianFilipinoFinnishFrenchFrench American IndianFrench CanadianGermanGerman RussianGhanaianGreekGuamanian/ChamorroGuatemalanGuyaneseHaitianHmongHonduranHopiHoumaHungarianIcelanderIndian (Asian)IndonesianInupiatIranianIraqiIrishIroquoisIsraeliItalianJamaicanJapaneseJordanianKenyanKiowaKoreanLaotianLatvianLebaneseLiberianLithuanianLumbeeLuxembourgerMacedonianMalaysianMalteseMarshalleseMenomineeMexicanMexican American IndianMongolianMoroccanNative HawaiianNavajoNepaleseNew ZealanderNicaraguanNigerianNorthern EuropeanNorwegianOkinawanOsageOttawaPaiutePakistaniPalestinianPanamanianParaguayanPennsylvania GermanPeruvianPimaPolishPortuguesePotawatomiPuebloPuerto RicanPuget Sound SalishRomanianRussianSalvadoranSamoanScandinavianScotch-IrishScottishSeminoleSenegaleseSerbianShoshoneSierra LeoneanSiouxSlavicSlovakSloveneSomaliSouth AfricanSouth AmericanSouth American IndianSoviet UnionSpaniardSpanishSpanish AmericanSpanish American IndianSri LankanSubsaharan AfricanSudaneseSwedishSwissSyrianTaiwaneseThaiTlingit-HaidaTohono O'OdhamTonganTrinidadian and TobagonianTsimshianTurkishU.S. Virgin IslanderUgandanUkrainianUruguayanUteVenezuelanVietnameseWelshWest IndianYakamaYaquiYugoslavianYumanYup'ikZimbabwean
Immigration
NonimmigrantsImmigrantsAfghanistanAfricaAlbaniaArgentinaArmeniaAsiaAustraliaAustriaBahamasBangladeshBarbadosBelarusBelgiumBelizeBoliviaBosnia and HerzegovinaBrazilBulgariaBurma/MyanmarCabo VerdeCambodiaCameroonCanadaCaribbeanCentral AmericaChileChinaColombiaCongoCosta RicaCroatiaCubaCzechoslovakiaDenmarkDominicaDominican RepublicEastern AfricaEastern AsiaEastern EuropeEcuadorEgyptEl SalvadorEnglandEritreaEthiopiaEuropeFijiFranceGermanyGhanaGreeceGrenadaGuatemalaGuyanaHaitiHondurasHong KongHungaryIndiaIndonesiaIranIraqIrelandIsraelItalyJamaicaJapanJordanKazakhstanKenyaKoreaKuwaitLaosLatin AmericaLatviaLebanonLiberiaLithuaniaMalaysiaMexicoMicronesiaMiddle AfricaMoldovaMoroccoNepalNetherlandsNicaraguaNigeriaNorth AmericaNorth MacedoniaNorthern AfricaNorthern EuropeNorwayOceaniaPanamaPeruPhilippinesPolandPortugalRomaniaRussiaSaudi ArabiaScotlandSenegalSerbiaSierra LeoneSingaporeSomaliaSouth AfricaSouth AmericaSouth Central AsiaSouth Eastern AsiaSouthern EuropeSpainSri LankaSt. Vincent and the GrenadinesSudanSwedenSwitzerlandSyriaTaiwanThailandTrinidad and TobagoTurkeyUgandaUkraineUruguayUzbekistanVenezuelaVietnamWest IndiesWestern AfricaWestern AsiaWestern EuropeYemenZaireZimbabweAzores
Immigrants from Pakistan
Race
Ancestry
AfghanAfricanAlaska NativeAlaskan AthabascanAlbanianAleutAlsatianAmericanApacheArabArapahoArgentineanArmenianAssyrian/Chaldean/SyriacAustralianAustrianBahamianBangladeshiBarbadianBasqueBelgianBelizeanBermudanBhutaneseBlackfeetBolivianBrazilianBritishBritish West IndianBulgarianBurmeseCajunCambodianCanadianCape VerdeanCarpatho RusynCelticCentral AmericanCentral American IndianCherokeeCheyenneChickasawChileanChineseChippewaChoctawColombianColvilleComancheCosta RicanCreeCreekCroatianCrowCubanCypriotCzechCzechoslovakianDanishDelawareDominicanDutchDutch West IndianEastern EuropeanEcuadorianEgyptianEnglishEstonianEthiopianEuropeanFijianFilipinoFinnishFrenchFrench American IndianFrench CanadianGermanGerman RussianGhanaianGreekGuamanian/ChamorroGuatemalanGuyaneseHaitianHmongHonduranHopiHoumaHungarianIcelanderIndian (Asian)IndonesianInupiatIranianIraqiIrishIroquoisIsraeliItalianJamaicanJapaneseJordanianKenyanKiowaKoreanLaotianLatvianLebaneseLiberianLithuanianLumbeeLuxembourgerMacedonianMalaysianMalteseMarshalleseMenomineeMexicanMexican American IndianMongolianMoroccanNative HawaiianNavajoNepaleseNew ZealanderNicaraguanNigerianNorthern EuropeanNorwegianOkinawanOsageOttawaPaiutePakistaniPalestinianPanamanianParaguayanPennsylvania GermanPeruvianPimaPolishPortuguesePotawatomiPuebloPuerto RicanPuget Sound SalishRomanianRussianSalvadoranSamoanScandinavianScotch-IrishScottishSeminoleSenegaleseSerbianShoshoneSierra LeoneanSiouxSlavicSlovakSloveneSomaliSouth AfricanSouth AmericanSouth American IndianSoviet UnionSpaniardSpanishSpanish AmericanSpanish American IndianSri LankanSubsaharan AfricanSudaneseSwedishSwissSyrianTaiwaneseThaiTlingit-HaidaTohono O'OdhamTonganTrinidadian and TobagonianTsimshianTurkishU.S. Virgin IslanderUgandanUkrainianUruguayanUteVenezuelanVietnameseWelshWest IndianYakamaYaquiYugoslavianYumanYup'ikZimbabwean
Immigration
ImmigrantsAfghanistanAfricaAlbaniaArgentinaArmeniaAsiaAustraliaAustriaBahamasBangladeshBarbadosBelarusBelgiumBelizeBoliviaBosnia and HerzegovinaBrazilBulgariaBurma/MyanmarCabo VerdeCambodiaCameroonCanadaCaribbeanCentral AmericaChileChinaColombiaCongoCosta RicaCroatiaCubaCzechoslovakiaDenmarkDominicaDominican RepublicEastern AfricaEastern AsiaEastern EuropeEcuadorEgyptEl SalvadorEnglandEritreaEthiopiaEuropeFijiFranceGermanyGhanaGreeceGrenadaGuatemalaGuyanaHaitiHondurasHong KongHungaryIndiaIndonesiaIranIraqIrelandIsraelItalyJamaicaJapanJordanKazakhstanKenyaKoreaKuwaitLaosLatin AmericaLatviaLebanonLiberiaLithuaniaMalaysiaMexicoMicronesiaMiddle AfricaMoldovaMoroccoNepalNetherlandsNicaraguaNigeriaNorth AmericaNorth MacedoniaNorthern AfricaNorthern EuropeNorwayOceaniaPakistanPanamaPeruPhilippinesPolandPortugalRomaniaRussiaSaudi ArabiaScotlandSenegalSerbiaSierra LeoneSingaporeSomaliaSouth AfricaSouth AmericaSouth Central AsiaSouth Eastern AsiaSouthern EuropeSpainSri LankaSt. Vincent and the GrenadinesSudanSwedenSwitzerlandSyriaTaiwanThailandTrinidad and TobagoTurkeyUgandaUkraineUruguayUzbekistanVenezuelaVietnamWest IndiesWestern AfricaWestern AsiaWestern EuropeYemenZaireZimbabweAzores
Female Poverty Among 18-24 Year Olds
Income
Poverty
Unemployment
Labor Participation
Family Structure
Vehicle Availability
Education Level
Disability

Female Poverty Among 18-24 Year Olds Comparison

Nonimmigrants

Immigrants from Pakistan

Tragic
Exceptional
21.5%
FEMALE POVERTY AMONG 18-24 YEAR OLDS
0.3/ 100
METRIC RATING
265th/ 347
METRIC RANK
17.0%
FEMALE POVERTY AMONG 18-24 YEAR OLDS
100.0/ 100
METRIC RATING
12th/ 347
METRIC RANK

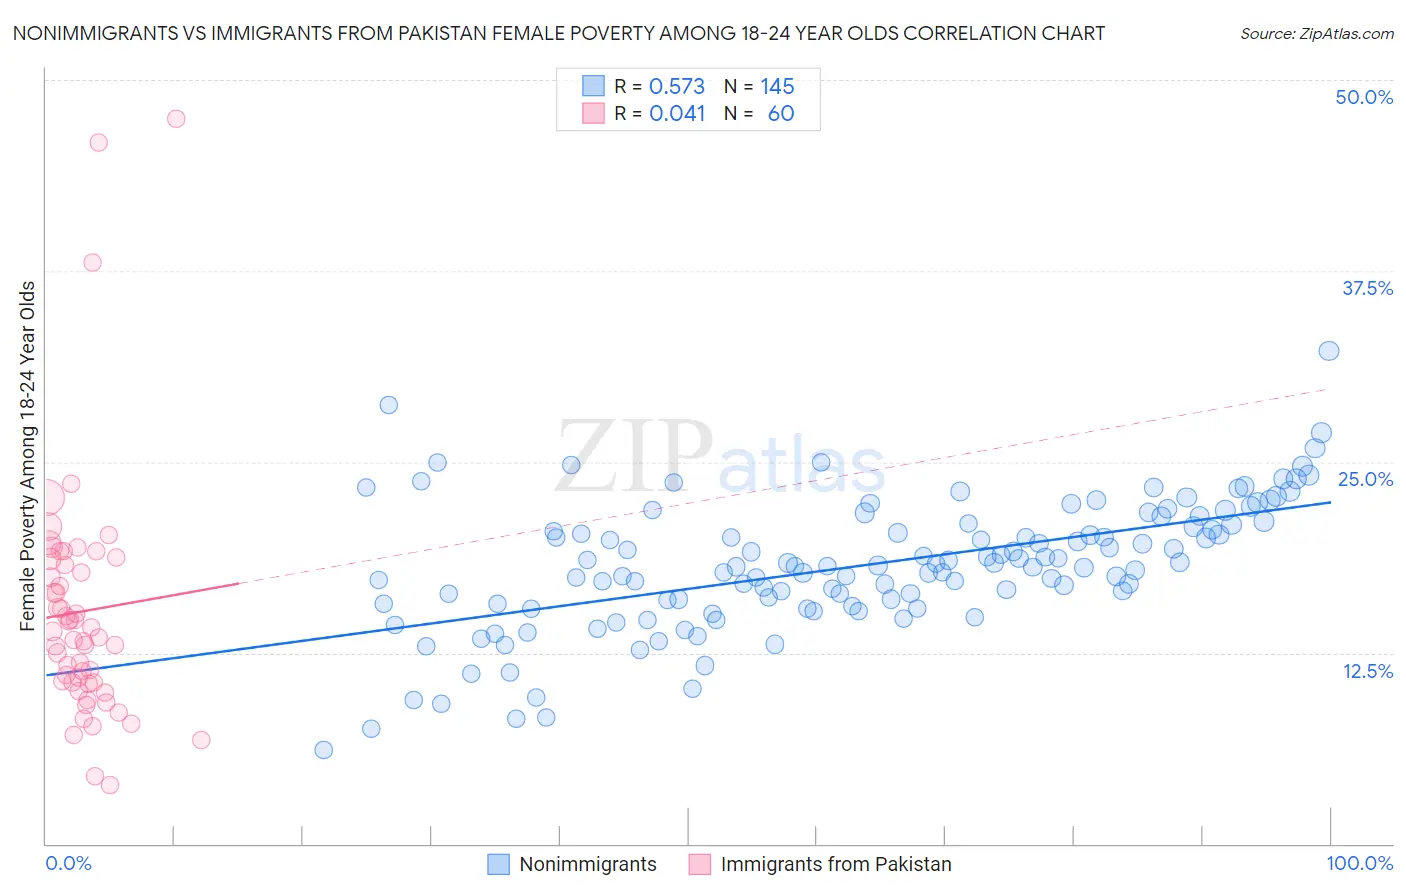
Nonimmigrants vs Immigrants from Pakistan Female Poverty Among 18-24 Year Olds Correlation Chart

The statistical analysis conducted on geographies consisting of 546,044,220 people shows a substantial positive correlation between the proportion of Nonimmigrants and poverty level among females between the ages 18 and 24 in the United States with a correlation coefficient (R) of 0.573 and weighted average of 21.5%. Similarly, the statistical analysis conducted on geographies consisting of 279,566,412 people shows no correlation between the proportion of Immigrants from Pakistan and poverty level among females between the ages 18 and 24 in the United States with a correlation coefficient (R) of 0.041 and weighted average of 17.0%, a difference of 26.7%.
Nonimmigrants vs Immigrants from Pakistan Female Poverty Among 18-24 Year Olds

Female Poverty Among 18-24 Year Olds Correlation Summary

MeasurementNonimmigrantsImmigrants from Pakistan
Minimum6.2%3.8%
Maximum32.3%47.5%
Range26.1%43.6%
Mean18.2%15.2%
Median18.2%13.7%
Interquartile 25% (IQ1)15.7%10.5%
Interquartile 75% (IQ3)20.9%18.5%
Interquartile Range (IQR)5.2%7.9%
Standard Deviation (Sample)4.3%8.0%
Standard Deviation (Population)4.2%8.0%

Similar Demographics by Female Poverty Among 18-24 Year Olds

Demographics Similar to Nonimmigrants by Female Poverty Among 18-24 Year Olds

In terms of female poverty among 18-24 year olds, the demographic groups most similar to Nonimmigrants are Honduran (21.5%, a difference of 0.010%), Icelander (21.5%, a difference of 0.060%), Alaska Native (21.5%, a difference of 0.070%), American (21.6%, a difference of 0.15%), and Immigrants from Burma/Myanmar (21.6%, a difference of 0.30%).
DemographicsRating | RankFemale Poverty Among 18-24 Year Olds
Vietnamese
0.6
/100
|
#258
Tragic
21.4%
Immigrants | France
0.6
/100
|
#259
Tragic
21.4%
Immigrants | Norway
0.6
/100
|
#260
Tragic
21.4%
Immigrants | Bahamas
0.5
/100
|
#261
Tragic
21.4%
Immigrants | Eastern Africa
0.4
/100
|
#262
Tragic
21.4%
Icelanders
0.3
/100
|
#263
Tragic
21.5%
Hondurans
0.3
/100
|
#264
Tragic
21.5%
Immigrants | Nonimmigrants
0.3
/100
|
#265
Tragic
21.5%
Alaska Natives
0.3
/100
|
#266
Tragic
21.5%
Americans
0.3
/100
|
#267
Tragic
21.6%
Immigrants | Burma/Myanmar
0.2
/100
|
#268
Tragic
21.6%
Celtics
0.2
/100
|
#269
Tragic
21.6%
Mongolians
0.2
/100
|
#270
Tragic
21.6%
Scotch-Irish
0.2
/100
|
#271
Tragic
21.6%
Basques
0.2
/100
|
#272
Tragic
21.7%

Demographics Similar to Immigrants from Pakistan by Female Poverty Among 18-24 Year Olds

In terms of female poverty among 18-24 year olds, the demographic groups most similar to Immigrants from Pakistan are Thai (17.0%, a difference of 0.090%), Korean (16.9%, a difference of 0.36%), Immigrants from Poland (17.1%, a difference of 0.66%), Immigrants from Peru (16.9%, a difference of 0.72%), and Tongan (17.1%, a difference of 0.83%).
DemographicsRating | RankFemale Poverty Among 18-24 Year Olds
Immigrants | Portugal
100.0
/100
|
#5
Exceptional
16.5%
Immigrants | Philippines
100.0
/100
|
#6
Exceptional
16.7%
Immigrants | Azores
100.0
/100
|
#7
Exceptional
16.7%
Immigrants | Bolivia
100.0
/100
|
#8
Exceptional
16.7%
Immigrants | Peru
100.0
/100
|
#9
Exceptional
16.9%
Koreans
100.0
/100
|
#10
Exceptional
16.9%
Thais
100.0
/100
|
#11
Exceptional
17.0%
Immigrants | Pakistan
100.0
/100
|
#12
Exceptional
17.0%
Immigrants | Poland
100.0
/100
|
#13
Exceptional
17.1%
Tongans
100.0
/100
|
#14
Exceptional
17.1%
Cubans
100.0
/100
|
#15
Exceptional
17.2%
Peruvians
100.0
/100
|
#16
Exceptional
17.2%
Immigrants | Taiwan
100.0
/100
|
#17
Exceptional
17.3%
Immigrants | Colombia
100.0
/100
|
#18
Exceptional
17.3%
Immigrants | Lithuania
100.0
/100
|
#19
Exceptional
17.4%