Navajo vs Immigrants from Guatemala Child Poverty Under the Age of 5
COMPARE
Navajo
Immigrants from Guatemala
Child Poverty Under the Age of 5
Child Poverty Under the Age of 5 Comparison
Navajo
Immigrants from Guatemala
31.6%
CHILD POVERTY UNDER THE AGE OF 5
0.0/ 100
METRIC RATING
345th/ 347
METRIC RANK
22.0%
CHILD POVERTY UNDER THE AGE OF 5
0.0/ 100
METRIC RATING
304th/ 347
METRIC RANK
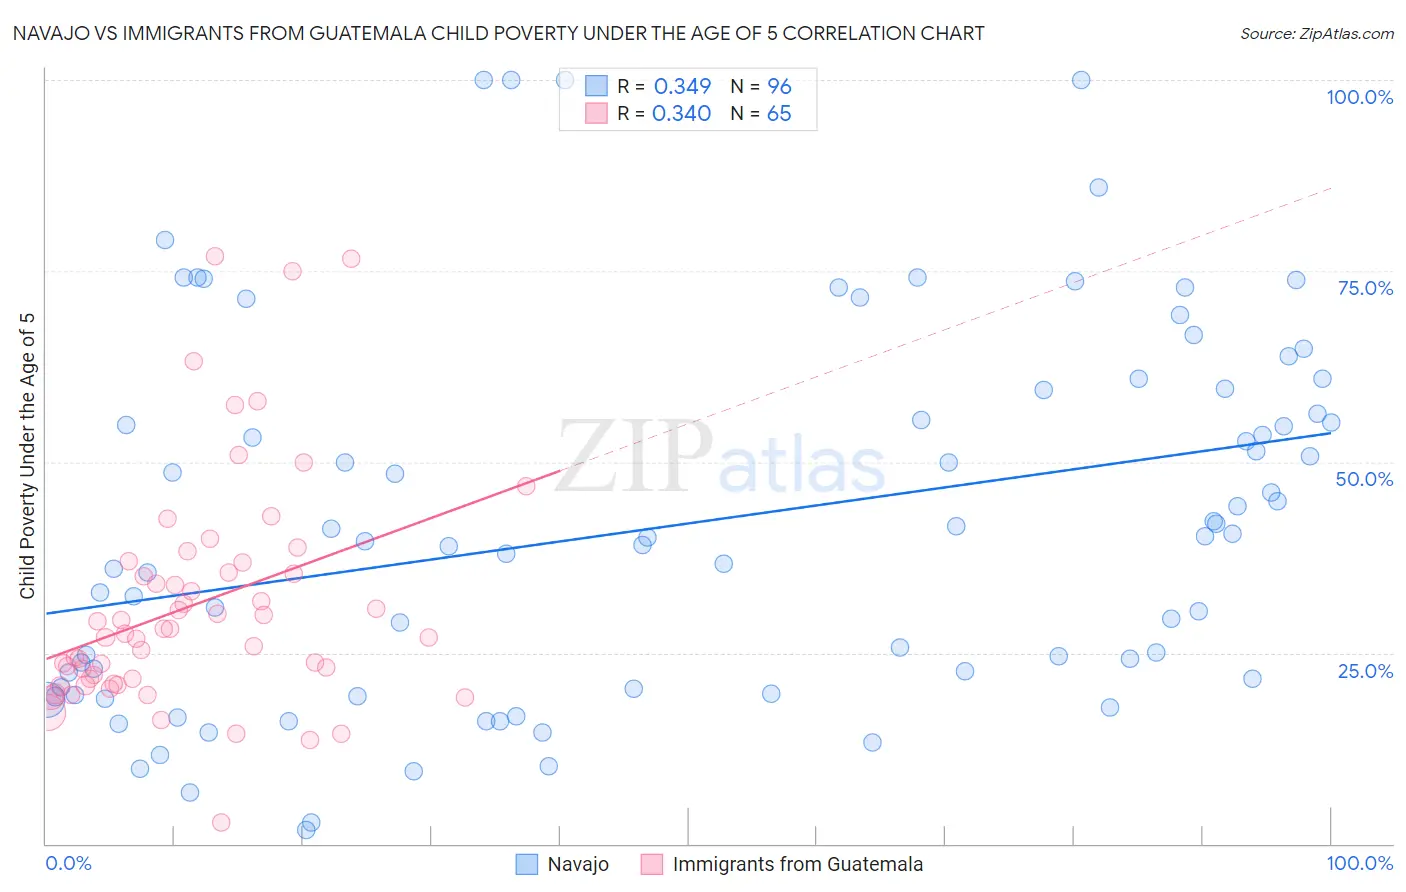
Navajo vs Immigrants from Guatemala Child Poverty Under the Age of 5 Correlation Chart
The statistical analysis conducted on geographies consisting of 221,390,478 people shows a mild positive correlation between the proportion of Navajo and poverty level among children under the age of 5 in the United States with a correlation coefficient (R) of 0.349 and weighted average of 31.6%. Similarly, the statistical analysis conducted on geographies consisting of 366,847,660 people shows a mild positive correlation between the proportion of Immigrants from Guatemala and poverty level among children under the age of 5 in the United States with a correlation coefficient (R) of 0.340 and weighted average of 22.0%, a difference of 43.3%.
Child Poverty Under the Age of 5 Correlation Summary
| Measurement | Navajo | Immigrants from Guatemala |
| Minimum | 1.8% | 2.8% |
| Maximum | 100.0% | 77.0% |
| Range | 98.2% | 74.2% |
| Mean | 41.8% | 31.2% |
| Median | 39.9% | 27.5% |
| Interquartile 25% (IQ1) | 20.4% | 21.3% |
| Interquartile 75% (IQ3) | 57.8% | 36.2% |
| Interquartile Range (IQR) | 37.4% | 14.9% |
| Standard Deviation (Sample) | 24.2% | 15.0% |
| Standard Deviation (Population) | 24.0% | 14.8% |
Similar Demographics by Child Poverty Under the Age of 5
Demographics Similar to Navajo by Child Poverty Under the Age of 5
In terms of child poverty under the age of 5, the demographic groups most similar to Navajo are Crow (31.0%, a difference of 1.9%), Lumbee (33.3%, a difference of 5.4%), Yuman (29.5%, a difference of 6.9%), Tohono O'odham (29.5%, a difference of 7.1%), and Immigrants from Yemen (29.3%, a difference of 7.8%).
| Demographics | Rating | Rank | Child Poverty Under the Age of 5 |
| Natives/Alaskans | 0.0 /100 | #333 | Tragic 25.6% |
| Blacks/African Americans | 0.0 /100 | #334 | Tragic 25.7% |
| Colville | 0.0 /100 | #335 | Tragic 25.7% |
| Sioux | 0.0 /100 | #336 | Tragic 26.9% |
| Pima | 0.0 /100 | #337 | Tragic 27.4% |
| Hopi | 0.0 /100 | #338 | Tragic 27.7% |
| Yup'ik | 0.0 /100 | #339 | Tragic 27.7% |
| Cheyenne | 0.0 /100 | #340 | Tragic 28.3% |
| Immigrants | Yemen | 0.0 /100 | #341 | Tragic 29.3% |
| Tohono O'odham | 0.0 /100 | #342 | Tragic 29.5% |
| Yuman | 0.0 /100 | #343 | Tragic 29.5% |
| Crow | 0.0 /100 | #344 | Tragic 31.0% |
| Navajo | 0.0 /100 | #345 | Tragic 31.6% |
| Lumbee | 0.0 /100 | #346 | Tragic 33.3% |
| Puerto Ricans | 0.0 /100 | #347 | Tragic 34.5% |
Demographics Similar to Immigrants from Guatemala by Child Poverty Under the Age of 5
In terms of child poverty under the age of 5, the demographic groups most similar to Immigrants from Guatemala are Inupiat (22.0%, a difference of 0.11%), Iroquois (22.0%, a difference of 0.20%), Immigrants from Central America (22.0%, a difference of 0.36%), Immigrants from Mexico (22.2%, a difference of 0.87%), and Indonesian (22.3%, a difference of 0.92%).
| Demographics | Rating | Rank | Child Poverty Under the Age of 5 |
| Hispanics or Latinos | 0.0 /100 | #297 | Tragic 21.7% |
| Blackfeet | 0.0 /100 | #298 | Tragic 21.8% |
| Chickasaw | 0.0 /100 | #299 | Tragic 21.8% |
| Alaskan Athabascans | 0.0 /100 | #300 | Tragic 21.8% |
| Immigrants | Central America | 0.0 /100 | #301 | Tragic 22.0% |
| Iroquois | 0.0 /100 | #302 | Tragic 22.0% |
| Inupiat | 0.0 /100 | #303 | Tragic 22.0% |
| Immigrants | Guatemala | 0.0 /100 | #304 | Tragic 22.0% |
| Immigrants | Mexico | 0.0 /100 | #305 | Tragic 22.2% |
| Indonesians | 0.0 /100 | #306 | Tragic 22.3% |
| Immigrants | Bahamas | 0.0 /100 | #307 | Tragic 22.7% |
| Immigrants | Dominica | 0.0 /100 | #308 | Tragic 22.7% |
| Houma | 0.0 /100 | #309 | Tragic 22.7% |
| Africans | 0.0 /100 | #310 | Tragic 22.8% |
| Seminole | 0.0 /100 | #311 | Tragic 22.8% |