Navajo vs Delaware Child Poverty Under the Age of 5
COMPARE
Navajo
Delaware
Child Poverty Under the Age of 5
Child Poverty Under the Age of 5 Comparison
Navajo
Delaware
31.6%
CHILD POVERTY UNDER THE AGE OF 5
0.0/ 100
METRIC RATING
345th/ 347
METRIC RANK
18.7%
CHILD POVERTY UNDER THE AGE OF 5
3.4/ 100
METRIC RATING
218th/ 347
METRIC RANK
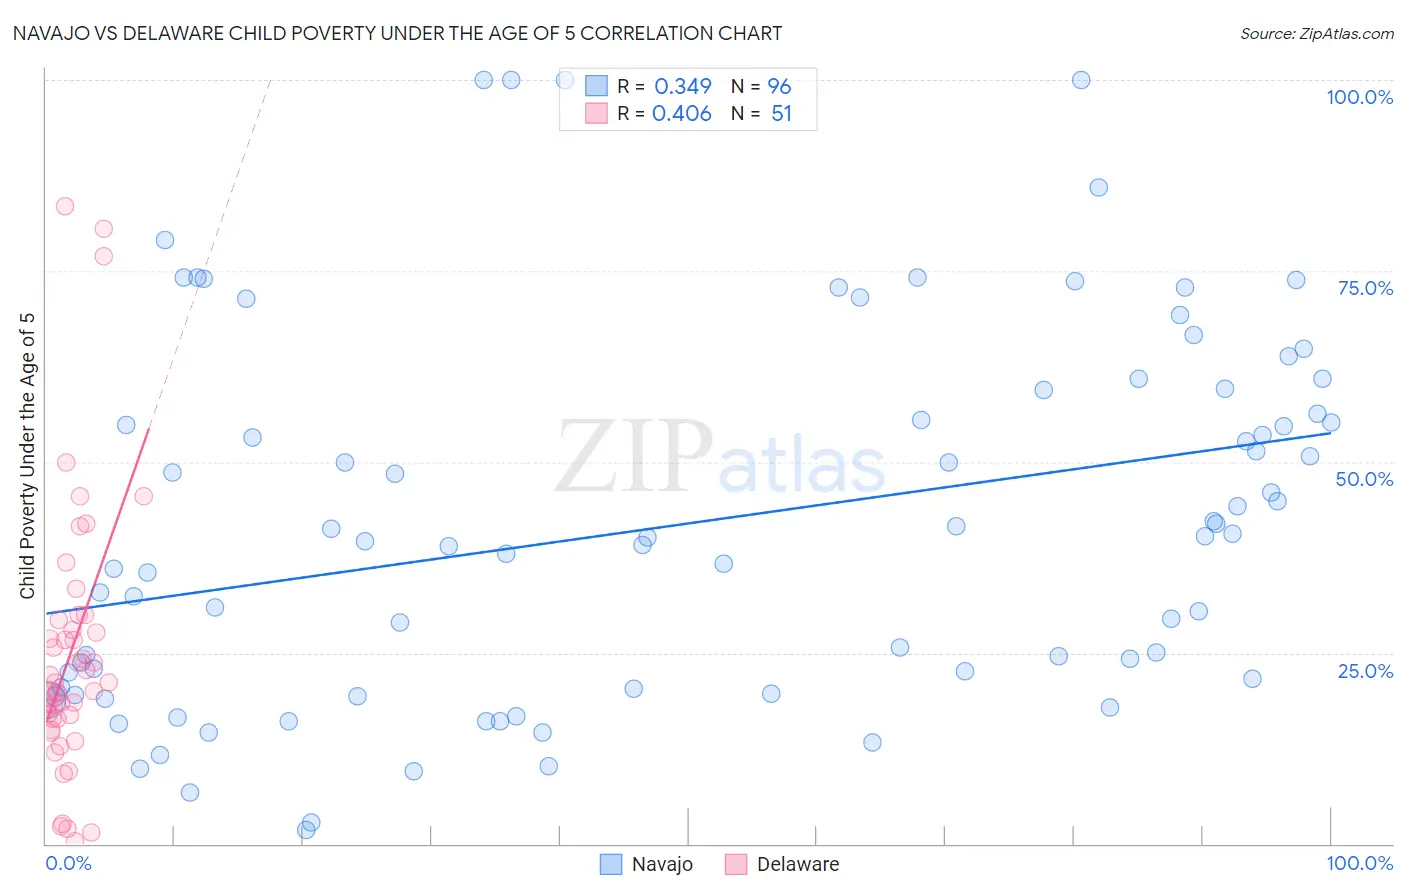
Navajo vs Delaware Child Poverty Under the Age of 5 Correlation Chart
The statistical analysis conducted on geographies consisting of 221,390,478 people shows a mild positive correlation between the proportion of Navajo and poverty level among children under the age of 5 in the United States with a correlation coefficient (R) of 0.349 and weighted average of 31.6%. Similarly, the statistical analysis conducted on geographies consisting of 94,801,216 people shows a moderate positive correlation between the proportion of Delaware and poverty level among children under the age of 5 in the United States with a correlation coefficient (R) of 0.406 and weighted average of 18.7%, a difference of 68.7%.
Child Poverty Under the Age of 5 Correlation Summary
| Measurement | Navajo | Delaware |
| Minimum | 1.8% | 0.41% |
| Maximum | 100.0% | 83.5% |
| Range | 98.2% | 83.1% |
| Mean | 41.8% | 25.0% |
| Median | 39.9% | 21.1% |
| Interquartile 25% (IQ1) | 20.4% | 16.3% |
| Interquartile 75% (IQ3) | 57.8% | 29.2% |
| Interquartile Range (IQR) | 37.4% | 12.9% |
| Standard Deviation (Sample) | 24.2% | 17.9% |
| Standard Deviation (Population) | 24.0% | 17.7% |
Similar Demographics by Child Poverty Under the Age of 5
Demographics Similar to Navajo by Child Poverty Under the Age of 5
In terms of child poverty under the age of 5, the demographic groups most similar to Navajo are Crow (31.0%, a difference of 1.9%), Lumbee (33.3%, a difference of 5.4%), Yuman (29.5%, a difference of 6.9%), Tohono O'odham (29.5%, a difference of 7.1%), and Immigrants from Yemen (29.3%, a difference of 7.8%).
| Demographics | Rating | Rank | Child Poverty Under the Age of 5 |
| Natives/Alaskans | 0.0 /100 | #333 | Tragic 25.6% |
| Blacks/African Americans | 0.0 /100 | #334 | Tragic 25.7% |
| Colville | 0.0 /100 | #335 | Tragic 25.7% |
| Sioux | 0.0 /100 | #336 | Tragic 26.9% |
| Pima | 0.0 /100 | #337 | Tragic 27.4% |
| Hopi | 0.0 /100 | #338 | Tragic 27.7% |
| Yup'ik | 0.0 /100 | #339 | Tragic 27.7% |
| Cheyenne | 0.0 /100 | #340 | Tragic 28.3% |
| Immigrants | Yemen | 0.0 /100 | #341 | Tragic 29.3% |
| Tohono O'odham | 0.0 /100 | #342 | Tragic 29.5% |
| Yuman | 0.0 /100 | #343 | Tragic 29.5% |
| Crow | 0.0 /100 | #344 | Tragic 31.0% |
| Navajo | 0.0 /100 | #345 | Tragic 31.6% |
| Lumbee | 0.0 /100 | #346 | Tragic 33.3% |
| Puerto Ricans | 0.0 /100 | #347 | Tragic 34.5% |
Demographics Similar to Delaware by Child Poverty Under the Age of 5
In terms of child poverty under the age of 5, the demographic groups most similar to Delaware are German Russian (18.8%, a difference of 0.32%), Immigrants from the Azores (18.9%, a difference of 0.67%), Immigrants from Africa (18.6%, a difference of 0.75%), Hmong (18.5%, a difference of 0.95%), and Immigrants from Nigeria (19.0%, a difference of 1.2%).
| Demographics | Rating | Rank | Child Poverty Under the Age of 5 |
| Moroccans | 9.4 /100 | #211 | Tragic 18.2% |
| Nepalese | 8.7 /100 | #212 | Tragic 18.3% |
| Immigrants | Thailand | 8.6 /100 | #213 | Tragic 18.3% |
| Malaysians | 6.5 /100 | #214 | Tragic 18.4% |
| Immigrants | Panama | 6.0 /100 | #215 | Tragic 18.5% |
| Hmong | 5.0 /100 | #216 | Tragic 18.5% |
| Immigrants | Africa | 4.6 /100 | #217 | Tragic 18.6% |
| Delaware | 3.4 /100 | #218 | Tragic 18.7% |
| German Russians | 3.0 /100 | #219 | Tragic 18.8% |
| Immigrants | Azores | 2.6 /100 | #220 | Tragic 18.9% |
| Immigrants | Nigeria | 2.1 /100 | #221 | Tragic 19.0% |
| Alsatians | 1.7 /100 | #222 | Tragic 19.1% |
| Cubans | 1.7 /100 | #223 | Tragic 19.1% |
| Nicaraguans | 1.6 /100 | #224 | Tragic 19.1% |
| Nigerians | 1.6 /100 | #225 | Tragic 19.1% |