Navajo vs Immigrants from Poland Child Poverty Under the Age of 5
COMPARE
Navajo
Immigrants from Poland
Child Poverty Under the Age of 5
Child Poverty Under the Age of 5 Comparison
Navajo
Immigrants from Poland
31.6%
CHILD POVERTY UNDER THE AGE OF 5
0.0/ 100
METRIC RATING
345th/ 347
METRIC RANK
15.1%
CHILD POVERTY UNDER THE AGE OF 5
99.1/ 100
METRIC RATING
61st/ 347
METRIC RANK
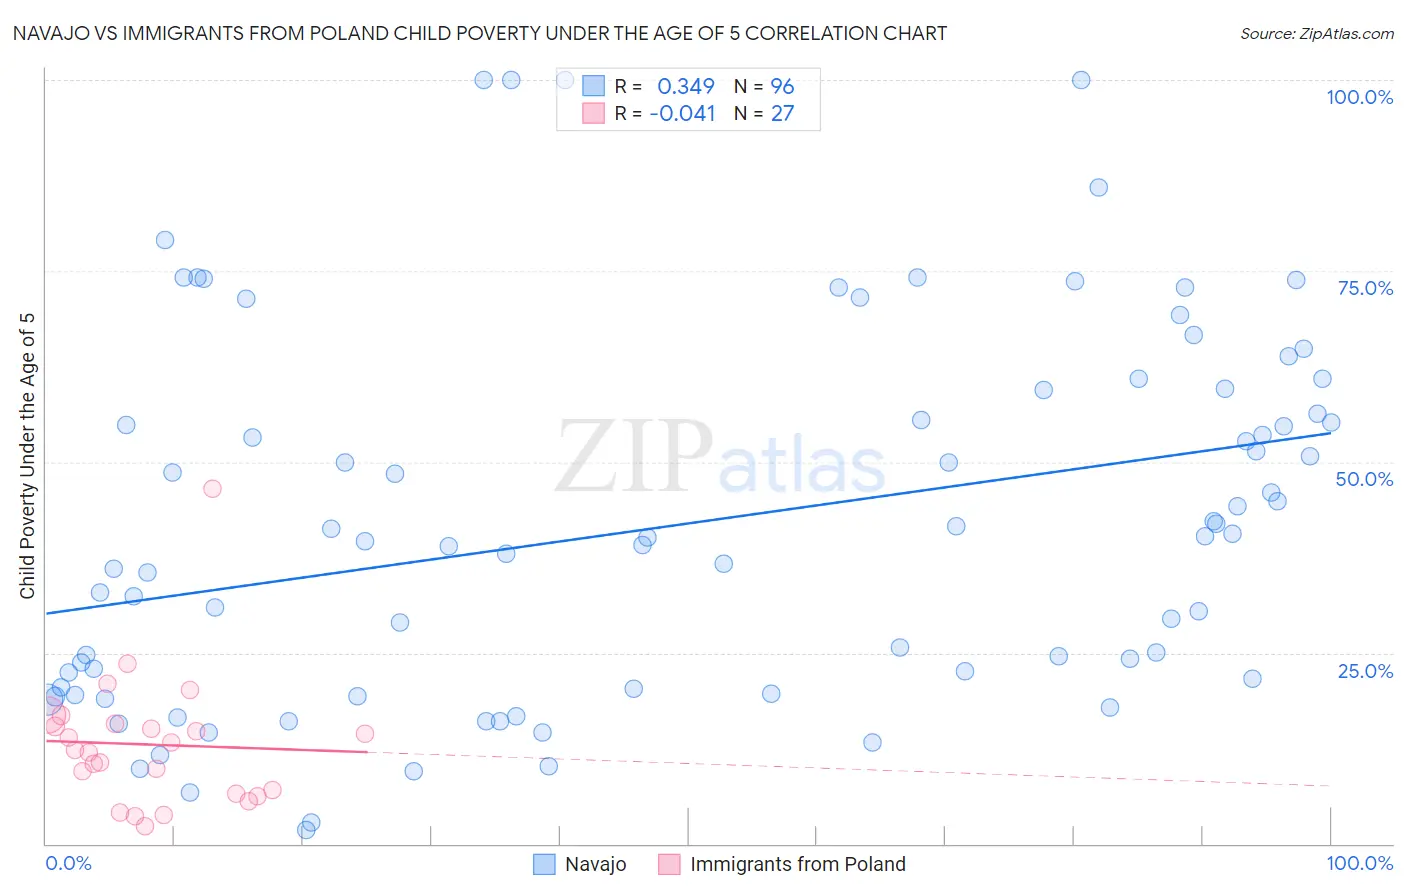
Navajo vs Immigrants from Poland Child Poverty Under the Age of 5 Correlation Chart
The statistical analysis conducted on geographies consisting of 221,390,478 people shows a mild positive correlation between the proportion of Navajo and poverty level among children under the age of 5 in the United States with a correlation coefficient (R) of 0.349 and weighted average of 31.6%. Similarly, the statistical analysis conducted on geographies consisting of 290,713,862 people shows no correlation between the proportion of Immigrants from Poland and poverty level among children under the age of 5 in the United States with a correlation coefficient (R) of -0.041 and weighted average of 15.1%, a difference of 109.1%.
Child Poverty Under the Age of 5 Correlation Summary
| Measurement | Navajo | Immigrants from Poland |
| Minimum | 1.8% | 2.2% |
| Maximum | 100.0% | 46.5% |
| Range | 98.2% | 44.3% |
| Mean | 41.8% | 13.0% |
| Median | 39.9% | 12.3% |
| Interquartile 25% (IQ1) | 20.4% | 6.5% |
| Interquartile 75% (IQ3) | 57.8% | 15.7% |
| Interquartile Range (IQR) | 37.4% | 9.2% |
| Standard Deviation (Sample) | 24.2% | 8.7% |
| Standard Deviation (Population) | 24.0% | 8.6% |
Similar Demographics by Child Poverty Under the Age of 5
Demographics Similar to Navajo by Child Poverty Under the Age of 5
In terms of child poverty under the age of 5, the demographic groups most similar to Navajo are Crow (31.0%, a difference of 1.9%), Lumbee (33.3%, a difference of 5.4%), Yuman (29.5%, a difference of 6.9%), Tohono O'odham (29.5%, a difference of 7.1%), and Immigrants from Yemen (29.3%, a difference of 7.8%).
| Demographics | Rating | Rank | Child Poverty Under the Age of 5 |
| Natives/Alaskans | 0.0 /100 | #333 | Tragic 25.6% |
| Blacks/African Americans | 0.0 /100 | #334 | Tragic 25.7% |
| Colville | 0.0 /100 | #335 | Tragic 25.7% |
| Sioux | 0.0 /100 | #336 | Tragic 26.9% |
| Pima | 0.0 /100 | #337 | Tragic 27.4% |
| Hopi | 0.0 /100 | #338 | Tragic 27.7% |
| Yup'ik | 0.0 /100 | #339 | Tragic 27.7% |
| Cheyenne | 0.0 /100 | #340 | Tragic 28.3% |
| Immigrants | Yemen | 0.0 /100 | #341 | Tragic 29.3% |
| Tohono O'odham | 0.0 /100 | #342 | Tragic 29.5% |
| Yuman | 0.0 /100 | #343 | Tragic 29.5% |
| Crow | 0.0 /100 | #344 | Tragic 31.0% |
| Navajo | 0.0 /100 | #345 | Tragic 31.6% |
| Lumbee | 0.0 /100 | #346 | Tragic 33.3% |
| Puerto Ricans | 0.0 /100 | #347 | Tragic 34.5% |
Demographics Similar to Immigrants from Poland by Child Poverty Under the Age of 5
In terms of child poverty under the age of 5, the demographic groups most similar to Immigrants from Poland are Immigrants from Eastern Europe (15.1%, a difference of 0.12%), Immigrants from Europe (15.1%, a difference of 0.25%), Immigrants from Romania (15.2%, a difference of 0.27%), Immigrants from Fiji (15.2%, a difference of 0.30%), and Immigrants from Scotland (15.2%, a difference of 0.42%).
| Demographics | Rating | Rank | Child Poverty Under the Age of 5 |
| Immigrants | Israel | 99.4 /100 | #54 | Exceptional 14.9% |
| Danes | 99.4 /100 | #55 | Exceptional 14.9% |
| Immigrants | Pakistan | 99.4 /100 | #56 | Exceptional 14.9% |
| Egyptians | 99.4 /100 | #57 | Exceptional 14.9% |
| Swedes | 99.4 /100 | #58 | Exceptional 15.0% |
| Paraguayans | 99.4 /100 | #59 | Exceptional 15.0% |
| Immigrants | Russia | 99.3 /100 | #60 | Exceptional 15.0% |
| Immigrants | Poland | 99.1 /100 | #61 | Exceptional 15.1% |
| Immigrants | Eastern Europe | 99.1 /100 | #62 | Exceptional 15.1% |
| Immigrants | Europe | 99.1 /100 | #63 | Exceptional 15.1% |
| Immigrants | Romania | 99.1 /100 | #64 | Exceptional 15.2% |
| Immigrants | Fiji | 99.0 /100 | #65 | Exceptional 15.2% |
| Immigrants | Scotland | 99.0 /100 | #66 | Exceptional 15.2% |
| Greeks | 99.0 /100 | #67 | Exceptional 15.2% |
| Zimbabweans | 99.0 /100 | #68 | Exceptional 15.2% |