Immigrants from Africa vs Immigrants from Guatemala Child Poverty Under the Age of 5
COMPARE
Immigrants from Africa
Immigrants from Guatemala
Child Poverty Under the Age of 5
Child Poverty Under the Age of 5 Comparison
Immigrants from Africa
Immigrants from Guatemala
18.6%
CHILD POVERTY UNDER THE AGE OF 5
4.6/ 100
METRIC RATING
217th/ 347
METRIC RANK
22.0%
CHILD POVERTY UNDER THE AGE OF 5
0.0/ 100
METRIC RATING
304th/ 347
METRIC RANK
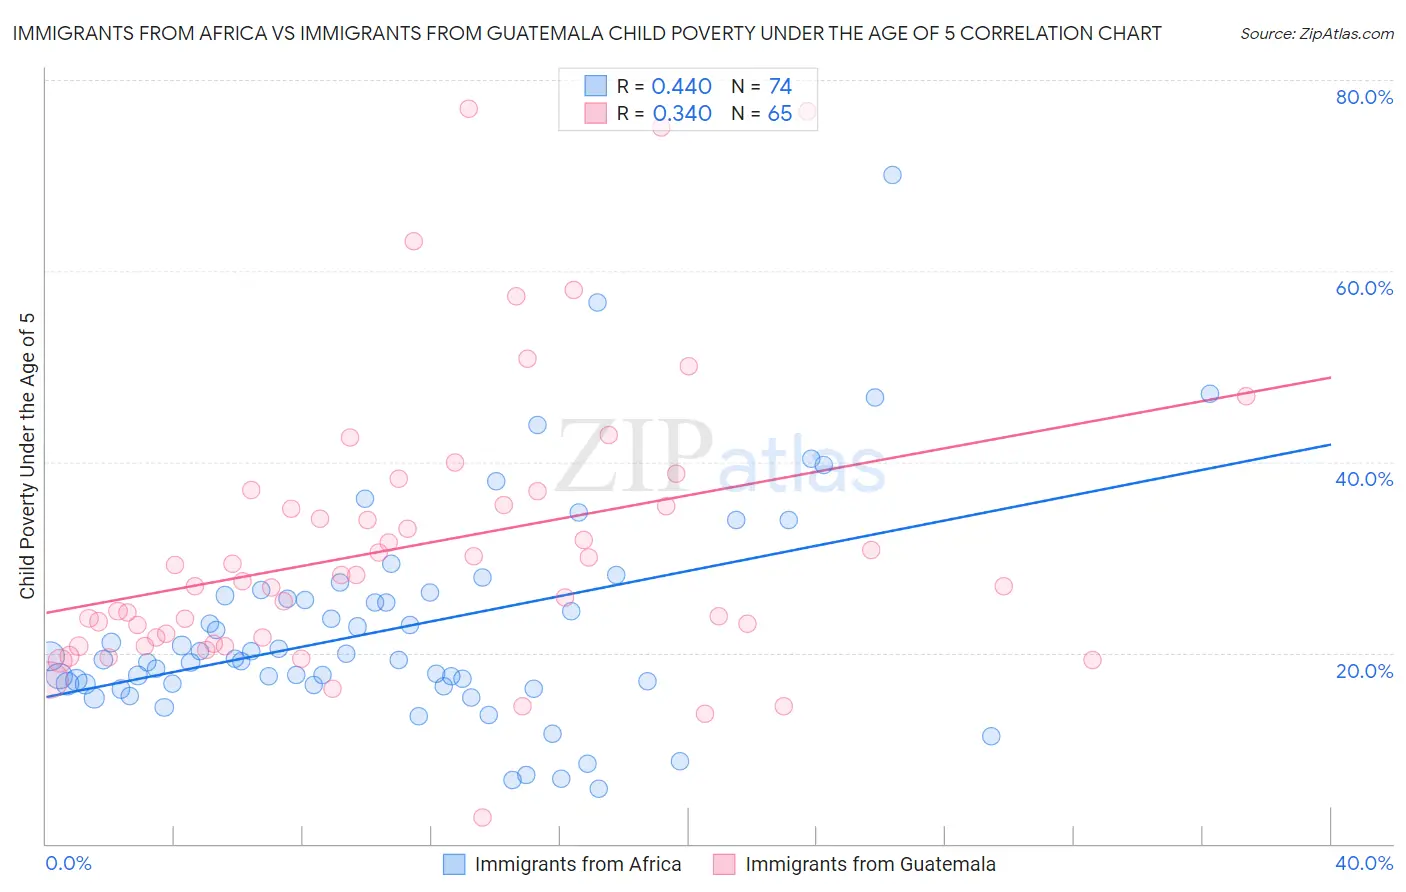
Immigrants from Africa vs Immigrants from Guatemala Child Poverty Under the Age of 5 Correlation Chart
The statistical analysis conducted on geographies consisting of 447,477,573 people shows a moderate positive correlation between the proportion of Immigrants from Africa and poverty level among children under the age of 5 in the United States with a correlation coefficient (R) of 0.440 and weighted average of 18.6%. Similarly, the statistical analysis conducted on geographies consisting of 366,847,660 people shows a mild positive correlation between the proportion of Immigrants from Guatemala and poverty level among children under the age of 5 in the United States with a correlation coefficient (R) of 0.340 and weighted average of 22.0%, a difference of 18.6%.
Child Poverty Under the Age of 5 Correlation Summary
| Measurement | Immigrants from Africa | Immigrants from Guatemala |
| Minimum | 5.7% | 2.8% |
| Maximum | 70.0% | 77.0% |
| Range | 64.3% | 74.2% |
| Mean | 22.6% | 31.2% |
| Median | 19.3% | 27.5% |
| Interquartile 25% (IQ1) | 16.7% | 21.3% |
| Interquartile 75% (IQ3) | 26.0% | 36.2% |
| Interquartile Range (IQR) | 9.3% | 14.9% |
| Standard Deviation (Sample) | 11.3% | 15.0% |
| Standard Deviation (Population) | 11.3% | 14.8% |
Similar Demographics by Child Poverty Under the Age of 5
Demographics Similar to Immigrants from Africa by Child Poverty Under the Age of 5
In terms of child poverty under the age of 5, the demographic groups most similar to Immigrants from Africa are Hmong (18.5%, a difference of 0.20%), Immigrants from Panama (18.5%, a difference of 0.66%), Delaware (18.7%, a difference of 0.75%), Malaysian (18.4%, a difference of 0.87%), and German Russian (18.8%, a difference of 1.1%).
| Demographics | Rating | Rank | Child Poverty Under the Age of 5 |
| Panamanians | 9.7 /100 | #210 | Tragic 18.2% |
| Moroccans | 9.4 /100 | #211 | Tragic 18.2% |
| Nepalese | 8.7 /100 | #212 | Tragic 18.3% |
| Immigrants | Thailand | 8.6 /100 | #213 | Tragic 18.3% |
| Malaysians | 6.5 /100 | #214 | Tragic 18.4% |
| Immigrants | Panama | 6.0 /100 | #215 | Tragic 18.5% |
| Hmong | 5.0 /100 | #216 | Tragic 18.5% |
| Immigrants | Africa | 4.6 /100 | #217 | Tragic 18.6% |
| Delaware | 3.4 /100 | #218 | Tragic 18.7% |
| German Russians | 3.0 /100 | #219 | Tragic 18.8% |
| Immigrants | Azores | 2.6 /100 | #220 | Tragic 18.9% |
| Immigrants | Nigeria | 2.1 /100 | #221 | Tragic 19.0% |
| Alsatians | 1.7 /100 | #222 | Tragic 19.1% |
| Cubans | 1.7 /100 | #223 | Tragic 19.1% |
| Nicaraguans | 1.6 /100 | #224 | Tragic 19.1% |
Demographics Similar to Immigrants from Guatemala by Child Poverty Under the Age of 5
In terms of child poverty under the age of 5, the demographic groups most similar to Immigrants from Guatemala are Inupiat (22.0%, a difference of 0.11%), Iroquois (22.0%, a difference of 0.20%), Immigrants from Central America (22.0%, a difference of 0.36%), Immigrants from Mexico (22.2%, a difference of 0.87%), and Indonesian (22.3%, a difference of 0.92%).
| Demographics | Rating | Rank | Child Poverty Under the Age of 5 |
| Hispanics or Latinos | 0.0 /100 | #297 | Tragic 21.7% |
| Blackfeet | 0.0 /100 | #298 | Tragic 21.8% |
| Chickasaw | 0.0 /100 | #299 | Tragic 21.8% |
| Alaskan Athabascans | 0.0 /100 | #300 | Tragic 21.8% |
| Immigrants | Central America | 0.0 /100 | #301 | Tragic 22.0% |
| Iroquois | 0.0 /100 | #302 | Tragic 22.0% |
| Inupiat | 0.0 /100 | #303 | Tragic 22.0% |
| Immigrants | Guatemala | 0.0 /100 | #304 | Tragic 22.0% |
| Immigrants | Mexico | 0.0 /100 | #305 | Tragic 22.2% |
| Indonesians | 0.0 /100 | #306 | Tragic 22.3% |
| Immigrants | Bahamas | 0.0 /100 | #307 | Tragic 22.7% |
| Immigrants | Dominica | 0.0 /100 | #308 | Tragic 22.7% |
| Houma | 0.0 /100 | #309 | Tragic 22.7% |
| Africans | 0.0 /100 | #310 | Tragic 22.8% |
| Seminole | 0.0 /100 | #311 | Tragic 22.8% |