Immigrants from Senegal vs Immigrants from Guatemala Child Poverty Under the Age of 5
COMPARE
Immigrants from Senegal
Immigrants from Guatemala
Child Poverty Under the Age of 5
Child Poverty Under the Age of 5 Comparison
Immigrants from Senegal
Immigrants from Guatemala
21.3%
CHILD POVERTY UNDER THE AGE OF 5
0.0/ 100
METRIC RATING
288th/ 347
METRIC RANK
22.0%
CHILD POVERTY UNDER THE AGE OF 5
0.0/ 100
METRIC RATING
304th/ 347
METRIC RANK
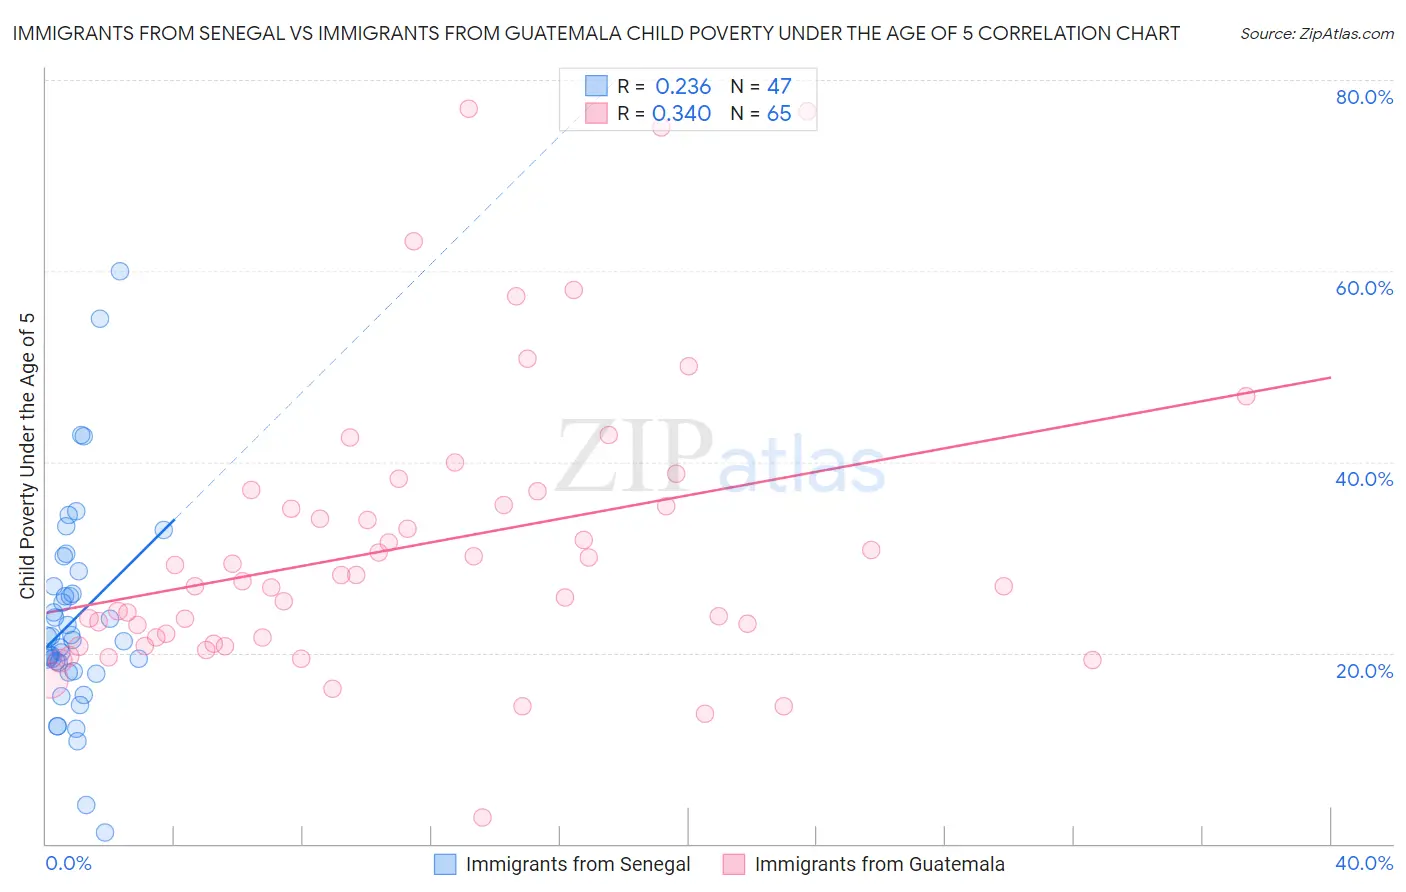
Immigrants from Senegal vs Immigrants from Guatemala Child Poverty Under the Age of 5 Correlation Chart
The statistical analysis conducted on geographies consisting of 89,495,365 people shows a weak positive correlation between the proportion of Immigrants from Senegal and poverty level among children under the age of 5 in the United States with a correlation coefficient (R) of 0.236 and weighted average of 21.3%. Similarly, the statistical analysis conducted on geographies consisting of 366,847,660 people shows a mild positive correlation between the proportion of Immigrants from Guatemala and poverty level among children under the age of 5 in the United States with a correlation coefficient (R) of 0.340 and weighted average of 22.0%, a difference of 3.6%.
Child Poverty Under the Age of 5 Correlation Summary
| Measurement | Immigrants from Senegal | Immigrants from Guatemala |
| Minimum | 1.2% | 2.8% |
| Maximum | 60.0% | 77.0% |
| Range | 58.8% | 74.2% |
| Mean | 23.5% | 31.2% |
| Median | 21.4% | 27.5% |
| Interquartile 25% (IQ1) | 18.1% | 21.3% |
| Interquartile 75% (IQ3) | 27.0% | 36.2% |
| Interquartile Range (IQR) | 8.9% | 14.9% |
| Standard Deviation (Sample) | 11.0% | 15.0% |
| Standard Deviation (Population) | 10.9% | 14.8% |
Demographics Similar to Immigrants from Senegal and Immigrants from Guatemala by Child Poverty Under the Age of 5
In terms of child poverty under the age of 5, the demographic groups most similar to Immigrants from Senegal are Immigrants from Haiti (21.3%, a difference of 0.070%), Immigrants from Zaire (21.3%, a difference of 0.17%), Immigrants from Latin America (21.2%, a difference of 0.27%), Immigrants from Caribbean (21.4%, a difference of 0.48%), and British West Indian (21.4%, a difference of 0.65%). Similarly, the demographic groups most similar to Immigrants from Guatemala are Inupiat (22.0%, a difference of 0.11%), Iroquois (22.0%, a difference of 0.20%), Immigrants from Central America (22.0%, a difference of 0.36%), Immigrants from Mexico (22.2%, a difference of 0.87%), and Indonesian (22.3%, a difference of 0.92%).
| Demographics | Rating | Rank | Child Poverty Under the Age of 5 |
| Immigrants | Latin America | 0.0 /100 | #286 | Tragic 21.2% |
| Immigrants | Zaire | 0.0 /100 | #287 | Tragic 21.3% |
| Immigrants | Senegal | 0.0 /100 | #288 | Tragic 21.3% |
| Immigrants | Haiti | 0.0 /100 | #289 | Tragic 21.3% |
| Immigrants | Caribbean | 0.0 /100 | #290 | Tragic 21.4% |
| British West Indians | 0.0 /100 | #291 | Tragic 21.4% |
| Immigrants | Somalia | 0.0 /100 | #292 | Tragic 21.6% |
| Mexicans | 0.0 /100 | #293 | Tragic 21.6% |
| Guatemalans | 0.0 /100 | #294 | Tragic 21.6% |
| Cherokee | 0.0 /100 | #295 | Tragic 21.7% |
| Yaqui | 0.0 /100 | #296 | Tragic 21.7% |
| Hispanics or Latinos | 0.0 /100 | #297 | Tragic 21.7% |
| Blackfeet | 0.0 /100 | #298 | Tragic 21.8% |
| Chickasaw | 0.0 /100 | #299 | Tragic 21.8% |
| Alaskan Athabascans | 0.0 /100 | #300 | Tragic 21.8% |
| Immigrants | Central America | 0.0 /100 | #301 | Tragic 22.0% |
| Iroquois | 0.0 /100 | #302 | Tragic 22.0% |
| Inupiat | 0.0 /100 | #303 | Tragic 22.0% |
| Immigrants | Guatemala | 0.0 /100 | #304 | Tragic 22.0% |
| Immigrants | Mexico | 0.0 /100 | #305 | Tragic 22.2% |
| Indonesians | 0.0 /100 | #306 | Tragic 22.3% |