Navajo vs Immigrants from Chile Child Poverty Under the Age of 16
COMPARE
Navajo
Immigrants from Chile
Child Poverty Under the Age of 16
Child Poverty Under the Age of 16 Comparison
Navajo
Immigrants from Chile
30.2%
CHILD POVERTY UNDER THE AGE OF 16
0.0/ 100
METRIC RATING
344th/ 347
METRIC RANK
15.7%
CHILD POVERTY UNDER THE AGE OF 16
72.8/ 100
METRIC RATING
158th/ 347
METRIC RANK
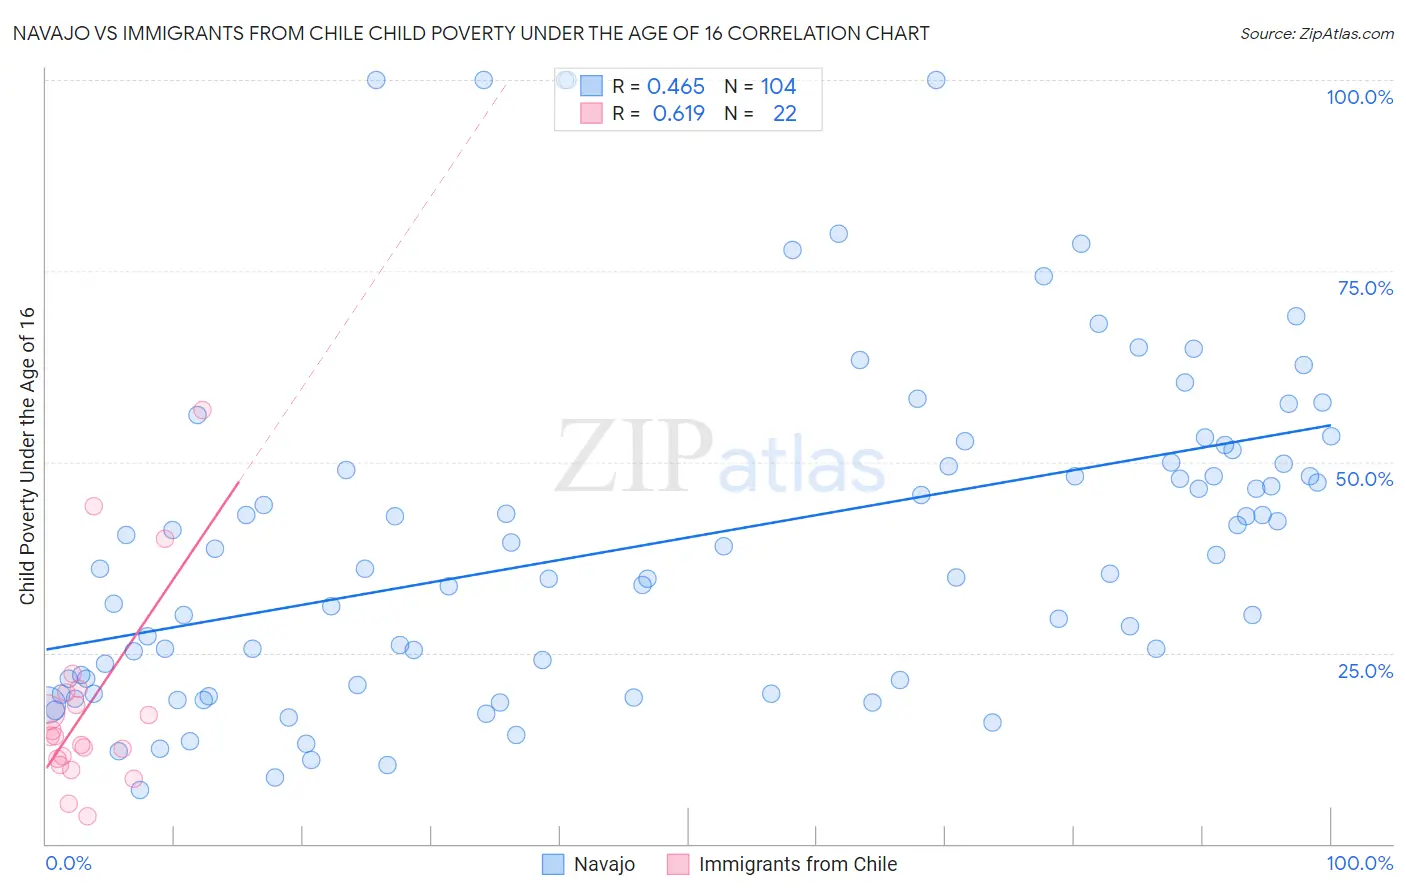
Navajo vs Immigrants from Chile Child Poverty Under the Age of 16 Correlation Chart
The statistical analysis conducted on geographies consisting of 224,099,770 people shows a moderate positive correlation between the proportion of Navajo and poverty level among children under the age of 16 in the United States with a correlation coefficient (R) of 0.465 and weighted average of 30.2%. Similarly, the statistical analysis conducted on geographies consisting of 217,865,801 people shows a significant positive correlation between the proportion of Immigrants from Chile and poverty level among children under the age of 16 in the United States with a correlation coefficient (R) of 0.619 and weighted average of 15.7%, a difference of 92.3%.
Child Poverty Under the Age of 16 Correlation Summary
| Measurement | Navajo | Immigrants from Chile |
| Minimum | 7.1% | 3.6% |
| Maximum | 100.0% | 56.8% |
| Range | 92.9% | 53.2% |
| Mean | 39.7% | 18.0% |
| Median | 36.9% | 14.0% |
| Interquartile 25% (IQ1) | 21.5% | 11.2% |
| Interquartile 75% (IQ3) | 49.9% | 19.8% |
| Interquartile Range (IQR) | 28.4% | 8.6% |
| Standard Deviation (Sample) | 22.0% | 12.9% |
| Standard Deviation (Population) | 21.9% | 12.6% |
Similar Demographics by Child Poverty Under the Age of 16
Demographics Similar to Navajo by Child Poverty Under the Age of 16
In terms of child poverty under the age of 16, the demographic groups most similar to Navajo are Lumbee (31.0%, a difference of 2.5%), Immigrants from Yemen (29.1%, a difference of 4.0%), Pima (29.0%, a difference of 4.2%), Yuman (28.9%, a difference of 4.4%), and Tohono O'odham (31.7%, a difference of 4.9%).
| Demographics | Rating | Rank | Child Poverty Under the Age of 16 |
| Immigrants | Dominican Republic | 0.0 /100 | #333 | Tragic 24.0% |
| Blacks/African Americans | 0.0 /100 | #334 | Tragic 24.4% |
| Houma | 0.0 /100 | #335 | Tragic 24.9% |
| Yup'ik | 0.0 /100 | #336 | Tragic 25.1% |
| Sioux | 0.0 /100 | #337 | Tragic 25.2% |
| Cheyenne | 0.0 /100 | #338 | Tragic 25.4% |
| Crow | 0.0 /100 | #339 | Tragic 26.0% |
| Hopi | 0.0 /100 | #340 | Tragic 27.1% |
| Yuman | 0.0 /100 | #341 | Tragic 28.9% |
| Pima | 0.0 /100 | #342 | Tragic 29.0% |
| Immigrants | Yemen | 0.0 /100 | #343 | Tragic 29.1% |
| Navajo | 0.0 /100 | #344 | Tragic 30.2% |
| Lumbee | 0.0 /100 | #345 | Tragic 31.0% |
| Tohono O'odham | 0.0 /100 | #346 | Tragic 31.7% |
| Puerto Ricans | 0.0 /100 | #347 | Tragic 32.5% |
Demographics Similar to Immigrants from Chile by Child Poverty Under the Age of 16
In terms of child poverty under the age of 16, the demographic groups most similar to Immigrants from Chile are Immigrants from Nepal (15.7%, a difference of 0.020%), Immigrants from Fiji (15.8%, a difference of 0.26%), Immigrants from Albania (15.8%, a difference of 0.32%), Immigrants from Venezuela (15.7%, a difference of 0.33%), and Syrian (15.6%, a difference of 0.53%).
| Demographics | Rating | Rank | Child Poverty Under the Age of 16 |
| French | 78.5 /100 | #151 | Good 15.6% |
| French Canadians | 78.2 /100 | #152 | Good 15.6% |
| Venezuelans | 77.4 /100 | #153 | Good 15.6% |
| Samoans | 77.3 /100 | #154 | Good 15.6% |
| Syrians | 76.1 /100 | #155 | Good 15.6% |
| Immigrants | Venezuela | 74.9 /100 | #156 | Good 15.7% |
| Immigrants | Nepal | 72.9 /100 | #157 | Good 15.7% |
| Immigrants | Chile | 72.8 /100 | #158 | Good 15.7% |
| Immigrants | Fiji | 71.1 /100 | #159 | Good 15.8% |
| Immigrants | Albania | 70.7 /100 | #160 | Good 15.8% |
| Immigrants | Northern Africa | 68.1 /100 | #161 | Good 15.8% |
| Colombians | 67.6 /100 | #162 | Good 15.8% |
| Yugoslavians | 67.6 /100 | #163 | Good 15.8% |
| Immigrants | Germany | 67.3 /100 | #164 | Good 15.8% |
| Guamanians/Chamorros | 66.4 /100 | #165 | Good 15.9% |