Filipino vs Immigrants from Chile Child Poverty Under the Age of 16
COMPARE
Filipino
Immigrants from Chile
Child Poverty Under the Age of 16
Child Poverty Under the Age of 16 Comparison
Filipinos
Immigrants from Chile
11.1%
CHILD POVERTY UNDER THE AGE OF 16
100.0/ 100
METRIC RATING
3rd/ 347
METRIC RANK
15.7%
CHILD POVERTY UNDER THE AGE OF 16
72.8/ 100
METRIC RATING
158th/ 347
METRIC RANK
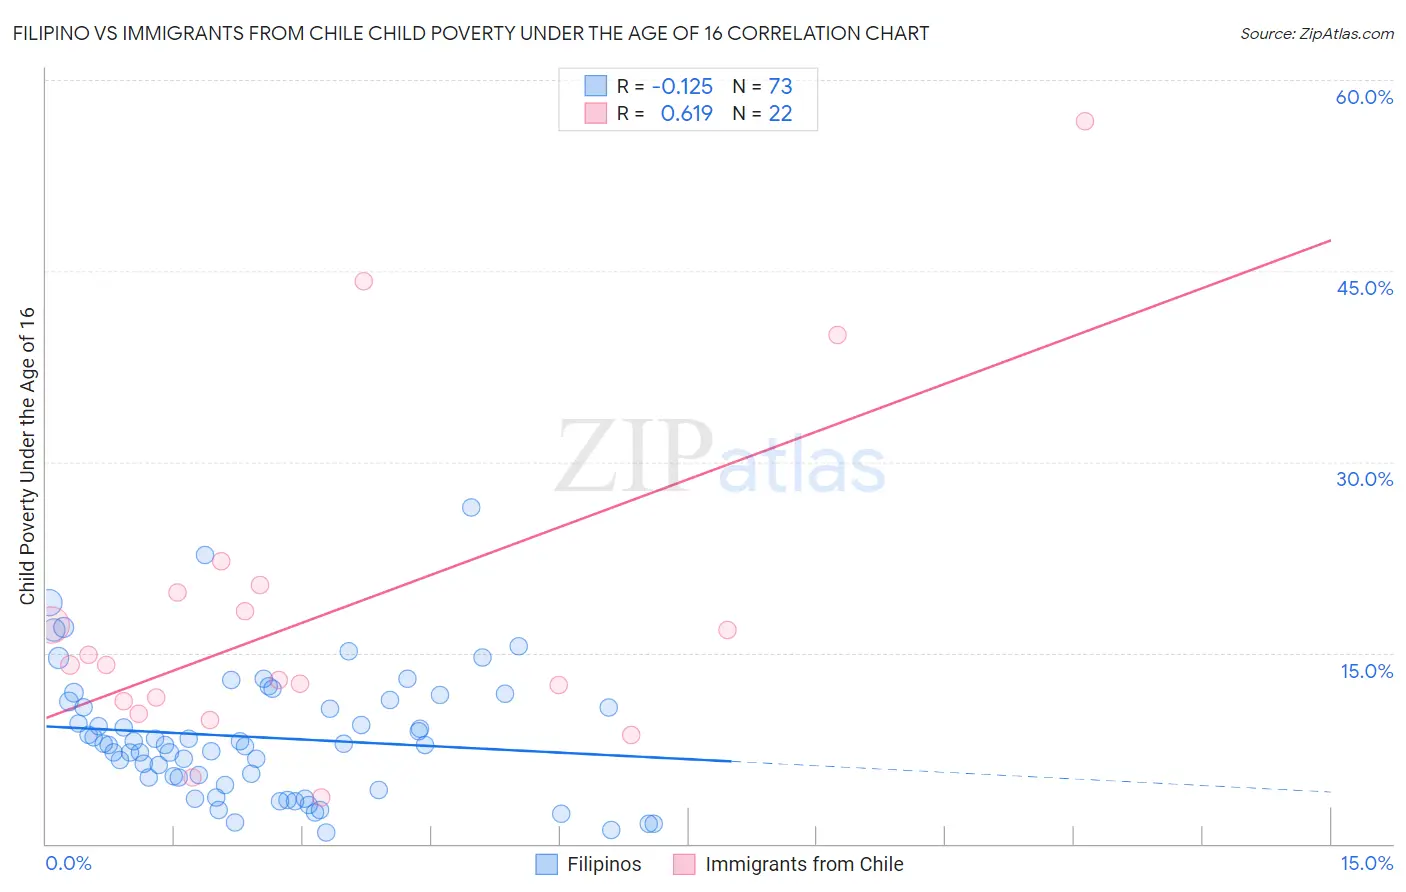
Filipino vs Immigrants from Chile Child Poverty Under the Age of 16 Correlation Chart
The statistical analysis conducted on geographies consisting of 252,527,529 people shows a poor negative correlation between the proportion of Filipinos and poverty level among children under the age of 16 in the United States with a correlation coefficient (R) of -0.125 and weighted average of 11.1%. Similarly, the statistical analysis conducted on geographies consisting of 217,865,801 people shows a significant positive correlation between the proportion of Immigrants from Chile and poverty level among children under the age of 16 in the United States with a correlation coefficient (R) of 0.619 and weighted average of 15.7%, a difference of 41.2%.
Child Poverty Under the Age of 16 Correlation Summary
| Measurement | Filipino | Immigrants from Chile |
| Minimum | 0.84% | 3.6% |
| Maximum | 26.4% | 56.8% |
| Range | 25.5% | 53.2% |
| Mean | 8.4% | 18.0% |
| Median | 7.8% | 14.0% |
| Interquartile 25% (IQ1) | 4.9% | 11.2% |
| Interquartile 75% (IQ3) | 11.2% | 19.8% |
| Interquartile Range (IQR) | 6.3% | 8.6% |
| Standard Deviation (Sample) | 5.0% | 12.9% |
| Standard Deviation (Population) | 4.9% | 12.6% |
Similar Demographics by Child Poverty Under the Age of 16
Demographics Similar to Filipinos by Child Poverty Under the Age of 16
In terms of child poverty under the age of 16, the demographic groups most similar to Filipinos are Immigrants from Taiwan (11.0%, a difference of 0.85%), Immigrants from India (10.8%, a difference of 3.4%), Thai (11.6%, a difference of 3.9%), Chinese (11.9%, a difference of 7.1%), and Immigrants from Hong Kong (12.1%, a difference of 9.0%).
| Demographics | Rating | Rank | Child Poverty Under the Age of 16 |
| Immigrants | India | 100.0 /100 | #1 | Exceptional 10.8% |
| Immigrants | Taiwan | 100.0 /100 | #2 | Exceptional 11.0% |
| Filipinos | 100.0 /100 | #3 | Exceptional 11.1% |
| Thais | 100.0 /100 | #4 | Exceptional 11.6% |
| Chinese | 100.0 /100 | #5 | Exceptional 11.9% |
| Immigrants | Hong Kong | 100.0 /100 | #6 | Exceptional 12.1% |
| Iranians | 100.0 /100 | #7 | Exceptional 12.2% |
| Immigrants | Singapore | 100.0 /100 | #8 | Exceptional 12.4% |
| Immigrants | Iran | 100.0 /100 | #9 | Exceptional 12.4% |
| Immigrants | South Central Asia | 99.9 /100 | #10 | Exceptional 12.5% |
| Bhutanese | 99.9 /100 | #11 | Exceptional 12.5% |
| Immigrants | Ireland | 99.9 /100 | #12 | Exceptional 12.7% |
| Burmese | 99.9 /100 | #13 | Exceptional 12.8% |
| Immigrants | Lithuania | 99.9 /100 | #14 | Exceptional 12.9% |
| Immigrants | Korea | 99.9 /100 | #15 | Exceptional 13.0% |
Demographics Similar to Immigrants from Chile by Child Poverty Under the Age of 16
In terms of child poverty under the age of 16, the demographic groups most similar to Immigrants from Chile are Immigrants from Nepal (15.7%, a difference of 0.020%), Immigrants from Fiji (15.8%, a difference of 0.26%), Immigrants from Albania (15.8%, a difference of 0.32%), Immigrants from Venezuela (15.7%, a difference of 0.33%), and Syrian (15.6%, a difference of 0.53%).
| Demographics | Rating | Rank | Child Poverty Under the Age of 16 |
| French | 78.5 /100 | #151 | Good 15.6% |
| French Canadians | 78.2 /100 | #152 | Good 15.6% |
| Venezuelans | 77.4 /100 | #153 | Good 15.6% |
| Samoans | 77.3 /100 | #154 | Good 15.6% |
| Syrians | 76.1 /100 | #155 | Good 15.6% |
| Immigrants | Venezuela | 74.9 /100 | #156 | Good 15.7% |
| Immigrants | Nepal | 72.9 /100 | #157 | Good 15.7% |
| Immigrants | Chile | 72.8 /100 | #158 | Good 15.7% |
| Immigrants | Fiji | 71.1 /100 | #159 | Good 15.8% |
| Immigrants | Albania | 70.7 /100 | #160 | Good 15.8% |
| Immigrants | Northern Africa | 68.1 /100 | #161 | Good 15.8% |
| Colombians | 67.6 /100 | #162 | Good 15.8% |
| Yugoslavians | 67.6 /100 | #163 | Good 15.8% |
| Immigrants | Germany | 67.3 /100 | #164 | Good 15.8% |
| Guamanians/Chamorros | 66.4 /100 | #165 | Good 15.9% |