Native/Alaskan vs Yup'ik Receiving Food Stamps
COMPARE
Native/Alaskan
Yup'ik
Receiving Food Stamps
Receiving Food Stamps Comparison
Natives/Alaskans
Yup'ik
17.3%
RECEIVING FOOD STAMPS
0.0/ 100
METRIC RATING
321st/ 347
METRIC RANK
32.7%
RECEIVING FOOD STAMPS
0.0/ 100
METRIC RATING
347th/ 347
METRIC RANK
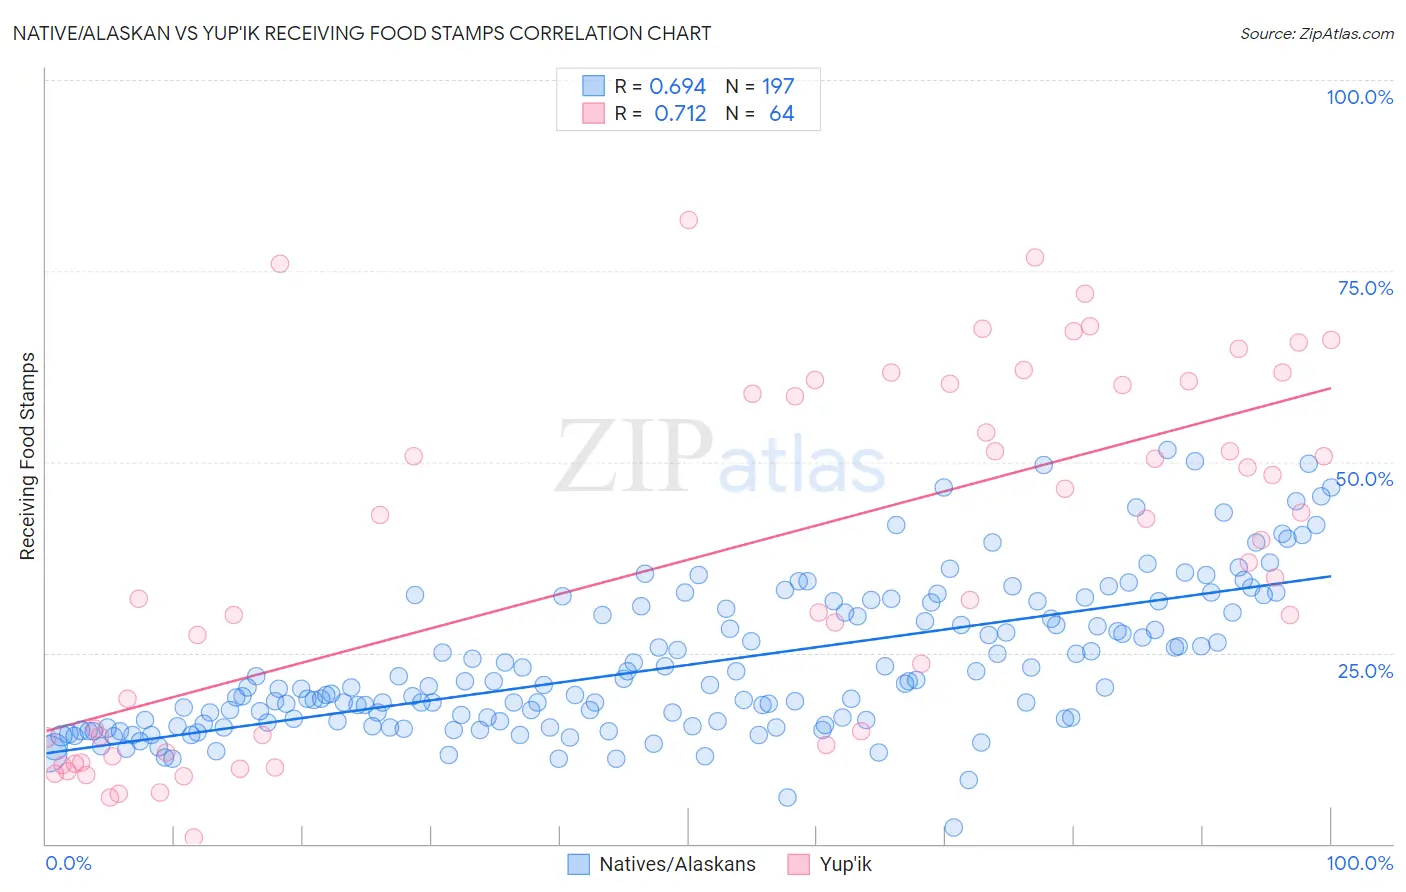
Native/Alaskan vs Yup'ik Receiving Food Stamps Correlation Chart
The statistical analysis conducted on geographies consisting of 511,480,561 people shows a significant positive correlation between the proportion of Natives/Alaskans and percentage of population receiving government assistance and/or food stamps in the United States with a correlation coefficient (R) of 0.694 and weighted average of 17.3%. Similarly, the statistical analysis conducted on geographies consisting of 39,947,156 people shows a strong positive correlation between the proportion of Yup'ik and percentage of population receiving government assistance and/or food stamps in the United States with a correlation coefficient (R) of 0.712 and weighted average of 32.7%, a difference of 89.2%.
Receiving Food Stamps Correlation Summary
| Measurement | Native/Alaskan | Yup'ik |
| Minimum | 2.2% | 0.80% |
| Maximum | 51.6% | 81.7% |
| Range | 49.4% | 80.9% |
| Mean | 23.4% | 37.7% |
| Median | 20.4% | 38.3% |
| Interquartile 25% (IQ1) | 15.8% | 13.5% |
| Interquartile 75% (IQ3) | 30.5% | 60.1% |
| Interquartile Range (IQR) | 14.7% | 46.6% |
| Standard Deviation (Sample) | 9.7% | 23.3% |
| Standard Deviation (Population) | 9.7% | 23.2% |
Similar Demographics by Receiving Food Stamps
Demographics Similar to Natives/Alaskans by Receiving Food Stamps
In terms of receiving food stamps, the demographic groups most similar to Natives/Alaskans are Immigrants from Nicaragua (17.2%, a difference of 0.18%), Immigrants from St. Vincent and the Grenadines (17.2%, a difference of 0.26%), Menominee (17.2%, a difference of 0.44%), Black/African American (17.2%, a difference of 0.62%), and Central American Indian (17.1%, a difference of 1.1%).
| Demographics | Rating | Rank | Receiving Food Stamps |
| Immigrants | Guyana | 0.0 /100 | #314 | Tragic 16.9% |
| Bahamians | 0.0 /100 | #315 | Tragic 17.0% |
| Central American Indians | 0.0 /100 | #316 | Tragic 17.1% |
| Blacks/African Americans | 0.0 /100 | #317 | Tragic 17.2% |
| Menominee | 0.0 /100 | #318 | Tragic 17.2% |
| Immigrants | St. Vincent and the Grenadines | 0.0 /100 | #319 | Tragic 17.2% |
| Immigrants | Nicaragua | 0.0 /100 | #320 | Tragic 17.2% |
| Natives/Alaskans | 0.0 /100 | #321 | Tragic 17.3% |
| Immigrants | Grenada | 0.0 /100 | #322 | Tragic 17.8% |
| Haitians | 0.0 /100 | #323 | Tragic 17.8% |
| British West Indians | 0.0 /100 | #324 | Tragic 17.9% |
| Immigrants | Haiti | 0.0 /100 | #325 | Tragic 18.2% |
| Cubans | 0.0 /100 | #326 | Tragic 18.2% |
| Apache | 0.0 /100 | #327 | Tragic 18.3% |
| Colville | 0.0 /100 | #328 | Tragic 18.3% |
Demographics Similar to Yup'ik by Receiving Food Stamps
In terms of receiving food stamps, the demographic groups most similar to Yup'ik are Puerto Rican (26.0%, a difference of 25.9%), Immigrants from Cabo Verde (23.8%, a difference of 37.0%), Lumbee (22.9%, a difference of 42.6%), Immigrants from Dominican Republic (22.1%, a difference of 47.7%), and Immigrants from Yemen (21.6%, a difference of 51.0%).
| Demographics | Rating | Rank | Receiving Food Stamps |
| Inupiat | 0.0 /100 | #333 | Tragic 20.1% |
| Yuman | 0.0 /100 | #334 | Tragic 20.2% |
| Immigrants | Cuba | 0.0 /100 | #335 | Tragic 20.8% |
| Navajo | 0.0 /100 | #336 | Tragic 21.1% |
| Cape Verdeans | 0.0 /100 | #337 | Tragic 21.1% |
| Dominicans | 0.0 /100 | #338 | Tragic 21.4% |
| Yakama | 0.0 /100 | #339 | Tragic 21.4% |
| Tohono O'odham | 0.0 /100 | #340 | Tragic 21.5% |
| Hopi | 0.0 /100 | #341 | Tragic 21.6% |
| Immigrants | Yemen | 0.0 /100 | #342 | Tragic 21.6% |
| Immigrants | Dominican Republic | 0.0 /100 | #343 | Tragic 22.1% |
| Lumbee | 0.0 /100 | #344 | Tragic 22.9% |
| Immigrants | Cabo Verde | 0.0 /100 | #345 | Tragic 23.8% |
| Puerto Ricans | 0.0 /100 | #346 | Tragic 26.0% |
| Yup'ik | 0.0 /100 | #347 | Tragic 32.7% |