Native/Alaskan vs Immigrants from Western Europe Receiving Food Stamps
COMPARE
Native/Alaskan
Immigrants from Western Europe
Receiving Food Stamps
Receiving Food Stamps Comparison
Natives/Alaskans
Immigrants from Western Europe
17.3%
RECEIVING FOOD STAMPS
0.0/ 100
METRIC RATING
321st/ 347
METRIC RANK
10.3%
RECEIVING FOOD STAMPS
96.9/ 100
METRIC RATING
100th/ 347
METRIC RANK
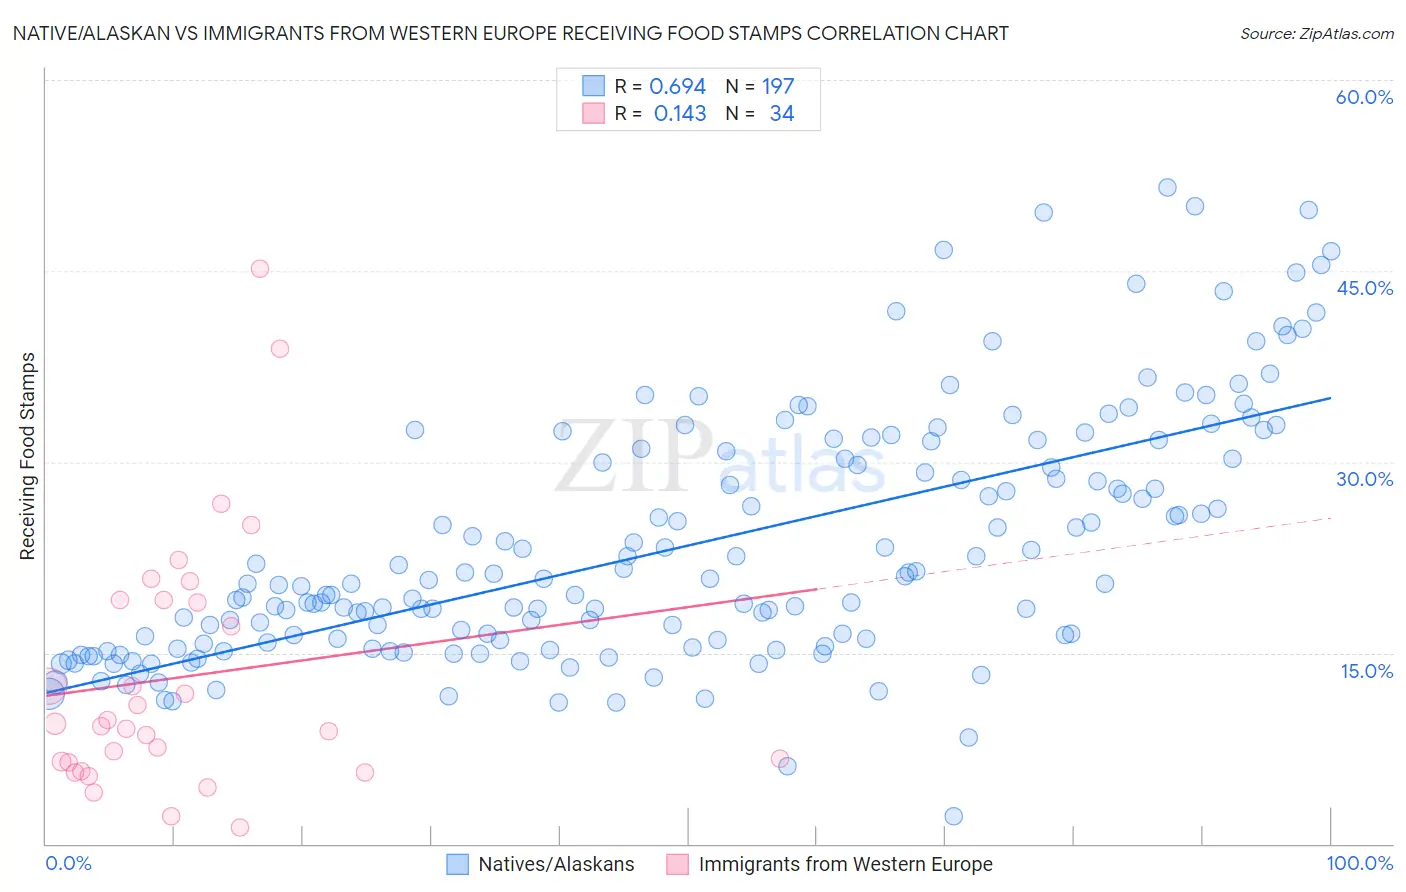
Native/Alaskan vs Immigrants from Western Europe Receiving Food Stamps Correlation Chart
The statistical analysis conducted on geographies consisting of 511,480,561 people shows a significant positive correlation between the proportion of Natives/Alaskans and percentage of population receiving government assistance and/or food stamps in the United States with a correlation coefficient (R) of 0.694 and weighted average of 17.3%. Similarly, the statistical analysis conducted on geographies consisting of 492,068,857 people shows a poor positive correlation between the proportion of Immigrants from Western Europe and percentage of population receiving government assistance and/or food stamps in the United States with a correlation coefficient (R) of 0.143 and weighted average of 10.3%, a difference of 67.3%.
Receiving Food Stamps Correlation Summary
| Measurement | Native/Alaskan | Immigrants from Western Europe |
| Minimum | 2.2% | 1.3% |
| Maximum | 51.6% | 45.2% |
| Range | 49.4% | 43.9% |
| Mean | 23.4% | 13.1% |
| Median | 20.4% | 9.4% |
| Interquartile 25% (IQ1) | 15.8% | 6.4% |
| Interquartile 75% (IQ3) | 30.5% | 19.1% |
| Interquartile Range (IQR) | 14.7% | 12.8% |
| Standard Deviation (Sample) | 9.7% | 10.0% |
| Standard Deviation (Population) | 9.7% | 9.8% |
Similar Demographics by Receiving Food Stamps
Demographics Similar to Natives/Alaskans by Receiving Food Stamps
In terms of receiving food stamps, the demographic groups most similar to Natives/Alaskans are Immigrants from Nicaragua (17.2%, a difference of 0.18%), Immigrants from St. Vincent and the Grenadines (17.2%, a difference of 0.26%), Menominee (17.2%, a difference of 0.44%), Black/African American (17.2%, a difference of 0.62%), and Central American Indian (17.1%, a difference of 1.1%).
| Demographics | Rating | Rank | Receiving Food Stamps |
| Immigrants | Guyana | 0.0 /100 | #314 | Tragic 16.9% |
| Bahamians | 0.0 /100 | #315 | Tragic 17.0% |
| Central American Indians | 0.0 /100 | #316 | Tragic 17.1% |
| Blacks/African Americans | 0.0 /100 | #317 | Tragic 17.2% |
| Menominee | 0.0 /100 | #318 | Tragic 17.2% |
| Immigrants | St. Vincent and the Grenadines | 0.0 /100 | #319 | Tragic 17.2% |
| Immigrants | Nicaragua | 0.0 /100 | #320 | Tragic 17.2% |
| Natives/Alaskans | 0.0 /100 | #321 | Tragic 17.3% |
| Immigrants | Grenada | 0.0 /100 | #322 | Tragic 17.8% |
| Haitians | 0.0 /100 | #323 | Tragic 17.8% |
| British West Indians | 0.0 /100 | #324 | Tragic 17.9% |
| Immigrants | Haiti | 0.0 /100 | #325 | Tragic 18.2% |
| Cubans | 0.0 /100 | #326 | Tragic 18.2% |
| Apache | 0.0 /100 | #327 | Tragic 18.3% |
| Colville | 0.0 /100 | #328 | Tragic 18.3% |
Demographics Similar to Immigrants from Western Europe by Receiving Food Stamps
In terms of receiving food stamps, the demographic groups most similar to Immigrants from Western Europe are Palestinian (10.3%, a difference of 0.0%), Immigrants from Europe (10.3%, a difference of 0.090%), Serbian (10.3%, a difference of 0.12%), Immigrants from Latvia (10.3%, a difference of 0.18%), and Immigrants from Hungary (10.3%, a difference of 0.20%).
| Demographics | Rating | Rank | Receiving Food Stamps |
| Belgians | 97.7 /100 | #93 | Exceptional 10.2% |
| Immigrants | Greece | 97.4 /100 | #94 | Exceptional 10.3% |
| Basques | 97.4 /100 | #95 | Exceptional 10.3% |
| Welsh | 97.3 /100 | #96 | Exceptional 10.3% |
| Czechoslovakians | 97.2 /100 | #97 | Exceptional 10.3% |
| Immigrants | Egypt | 97.1 /100 | #98 | Exceptional 10.3% |
| Serbians | 97.0 /100 | #99 | Exceptional 10.3% |
| Immigrants | Western Europe | 96.9 /100 | #100 | Exceptional 10.3% |
| Palestinians | 96.9 /100 | #101 | Exceptional 10.3% |
| Immigrants | Europe | 96.8 /100 | #102 | Exceptional 10.3% |
| Immigrants | Latvia | 96.8 /100 | #103 | Exceptional 10.3% |
| Immigrants | Hungary | 96.7 /100 | #104 | Exceptional 10.3% |
| Immigrants | Malaysia | 96.5 /100 | #105 | Exceptional 10.4% |
| Immigrants | Italy | 96.4 /100 | #106 | Exceptional 10.4% |
| Koreans | 96.3 /100 | #107 | Exceptional 10.4% |