Native/Alaskan vs Immigrants from Serbia Receiving Food Stamps

COMPARE

Native/Alaskan
Race
Ancestry
AfghanAfricanAlaska NativeAlaskan AthabascanAlbanianAleutAlsatianAmericanApacheArabArapahoArgentineanArmenianAssyrian/Chaldean/SyriacAustralianAustrianBahamianBangladeshiBarbadianBasqueBelgianBelizeanBermudanBhutaneseBlackfeetBolivianBrazilianBritishBritish West IndianBulgarianBurmeseCajunCambodianCanadianCape VerdeanCarpatho RusynCelticCentral AmericanCentral American IndianCherokeeCheyenneChickasawChileanChineseChippewaChoctawColombianColvilleComancheCosta RicanCreeCreekCroatianCrowCubanCypriotCzechCzechoslovakianDanishDelawareDominicanDutchDutch West IndianEastern EuropeanEcuadorianEgyptianEnglishEstonianEthiopianEuropeanFijianFilipinoFinnishFrenchFrench American IndianFrench CanadianGermanGerman RussianGhanaianGreekGuamanian/ChamorroGuatemalanGuyaneseHaitianHmongHonduranHopiHoumaHungarianIcelanderIndian (Asian)IndonesianInupiatIranianIraqiIrishIroquoisIsraeliItalianJamaicanJapaneseJordanianKenyanKiowaKoreanLaotianLatvianLebaneseLiberianLithuanianLumbeeLuxembourgerMacedonianMalaysianMalteseMarshalleseMenomineeMexicanMexican American IndianMongolianMoroccanNative HawaiianNavajoNepaleseNew ZealanderNicaraguanNigerianNorthern EuropeanNorwegianOkinawanOsageOttawaPaiutePakistaniPalestinianPanamanianParaguayanPennsylvania GermanPeruvianPimaPolishPortuguesePotawatomiPuebloPuerto RicanPuget Sound SalishRomanianRussianSalvadoranSamoanScandinavianScotch-IrishScottishSeminoleSenegaleseSerbianShoshoneSierra LeoneanSiouxSlavicSlovakSloveneSomaliSouth AfricanSouth AmericanSouth American IndianSoviet UnionSpaniardSpanishSpanish AmericanSpanish American IndianSri LankanSubsaharan AfricanSudaneseSwedishSwissSyrianTaiwaneseThaiTlingit-HaidaTohono O'OdhamTonganTrinidadian and TobagonianTsimshianTurkishU.S. Virgin IslanderUgandanUkrainianUruguayanUteVenezuelanVietnameseWelshWest IndianYakamaYaquiYugoslavianYumanYup'ikZimbabwean
Immigration
NonimmigrantsImmigrantsAfghanistanAfricaAlbaniaArgentinaArmeniaAsiaAustraliaAustriaBahamasBangladeshBarbadosBelarusBelgiumBelizeBoliviaBosnia and HerzegovinaBrazilBulgariaBurma/MyanmarCabo VerdeCambodiaCameroonCanadaCaribbeanCentral AmericaChileChinaColombiaCongoCosta RicaCroatiaCubaCzechoslovakiaDenmarkDominicaDominican RepublicEastern AfricaEastern AsiaEastern EuropeEcuadorEgyptEl SalvadorEnglandEritreaEthiopiaEuropeFijiFranceGermanyGhanaGreeceGrenadaGuatemalaGuyanaHaitiHondurasHong KongHungaryIndiaIndonesiaIranIraqIrelandIsraelItalyJamaicaJapanJordanKazakhstanKenyaKoreaKuwaitLaosLatin AmericaLatviaLebanonLiberiaLithuaniaMalaysiaMexicoMicronesiaMiddle AfricaMoldovaMoroccoNepalNetherlandsNicaraguaNigeriaNorth AmericaNorth MacedoniaNorthern AfricaNorthern EuropeNorwayOceaniaPakistanPanamaPeruPhilippinesPolandPortugalRomaniaRussiaSaudi ArabiaScotlandSenegalSierra LeoneSingaporeSomaliaSouth AfricaSouth AmericaSouth Central AsiaSouth Eastern AsiaSouthern EuropeSpainSri LankaSt. Vincent and the GrenadinesSudanSwedenSwitzerlandSyriaTaiwanThailandTrinidad and TobagoTurkeyUgandaUkraineUruguayUzbekistanVenezuelaVietnamWest IndiesWestern AfricaWestern AsiaWestern EuropeYemenZaireZimbabweAzores
Immigrants from Serbia
Race
Ancestry
AfghanAfricanAlaska NativeAlaskan AthabascanAlbanianAleutAlsatianAmericanApacheArabArapahoArgentineanArmenianAssyrian/Chaldean/SyriacAustralianAustrianBahamianBangladeshiBarbadianBasqueBelgianBelizeanBermudanBhutaneseBlackfeetBolivianBrazilianBritishBritish West IndianBulgarianBurmeseCajunCambodianCanadianCape VerdeanCarpatho RusynCelticCentral AmericanCentral American IndianCherokeeCheyenneChickasawChileanChineseChippewaChoctawColombianColvilleComancheCosta RicanCreeCreekCroatianCrowCubanCypriotCzechCzechoslovakianDanishDelawareDominicanDutchDutch West IndianEastern EuropeanEcuadorianEgyptianEnglishEstonianEthiopianEuropeanFijianFilipinoFinnishFrenchFrench American IndianFrench CanadianGermanGerman RussianGhanaianGreekGuamanian/ChamorroGuatemalanGuyaneseHaitianHmongHonduranHopiHoumaHungarianIcelanderIndian (Asian)IndonesianInupiatIranianIraqiIrishIroquoisIsraeliItalianJamaicanJapaneseJordanianKenyanKiowaKoreanLaotianLatvianLebaneseLiberianLithuanianLumbeeLuxembourgerMacedonianMalaysianMalteseMarshalleseMenomineeMexicanMexican American IndianMongolianMoroccanNative HawaiianNavajoNepaleseNew ZealanderNicaraguanNigerianNorthern EuropeanNorwegianOkinawanOsageOttawaPaiutePakistaniPalestinianPanamanianParaguayanPennsylvania GermanPeruvianPimaPolishPortuguesePotawatomiPuebloPuerto RicanPuget Sound SalishRomanianRussianSalvadoranSamoanScandinavianScotch-IrishScottishSeminoleSenegaleseSerbianShoshoneSierra LeoneanSiouxSlavicSlovakSloveneSomaliSouth AfricanSouth AmericanSouth American IndianSoviet UnionSpaniardSpanishSpanish AmericanSpanish American IndianSri LankanSubsaharan AfricanSudaneseSwedishSwissSyrianTaiwaneseThaiTlingit-HaidaTohono O'OdhamTonganTrinidadian and TobagonianTsimshianTurkishU.S. Virgin IslanderUgandanUkrainianUruguayanUteVenezuelanVietnameseWelshWest IndianYakamaYaquiYugoslavianYumanYup'ikZimbabwean
Immigration
NonimmigrantsImmigrantsAfghanistanAfricaAlbaniaArgentinaArmeniaAsiaAustraliaAustriaBahamasBangladeshBarbadosBelarusBelgiumBelizeBoliviaBosnia and HerzegovinaBrazilBulgariaBurma/MyanmarCabo VerdeCambodiaCameroonCanadaCaribbeanCentral AmericaChileChinaColombiaCongoCosta RicaCroatiaCubaCzechoslovakiaDenmarkDominicaDominican RepublicEastern AfricaEastern AsiaEastern EuropeEcuadorEgyptEl SalvadorEnglandEritreaEthiopiaEuropeFijiFranceGermanyGhanaGreeceGrenadaGuatemalaGuyanaHaitiHondurasHong KongHungaryIndiaIndonesiaIranIraqIrelandIsraelItalyJamaicaJapanJordanKazakhstanKenyaKoreaKuwaitLaosLatin AmericaLatviaLebanonLiberiaLithuaniaMalaysiaMexicoMicronesiaMiddle AfricaMoldovaMoroccoNepalNetherlandsNicaraguaNigeriaNorth AmericaNorth MacedoniaNorthern AfricaNorthern EuropeNorwayOceaniaPakistanPanamaPeruPhilippinesPolandPortugalRomaniaRussiaSaudi ArabiaScotlandSenegalSerbiaSierra LeoneSingaporeSomaliaSouth AfricaSouth AmericaSouth Central AsiaSouth Eastern AsiaSouthern EuropeSpainSri LankaSt. Vincent and the GrenadinesSudanSwedenSwitzerlandSyriaTaiwanThailandTrinidad and TobagoTurkeyUgandaUkraineUruguayUzbekistanVenezuelaVietnamWest IndiesWestern AfricaWestern AsiaWestern EuropeYemenZaireZimbabweAzores
Receiving Food Stamps
Income
Poverty
Unemployment
Labor Participation
Family Structure
Vehicle Availability
Education Level
Disability

Receiving Food Stamps Comparison

Natives/Alaskans

Immigrants from Serbia

Tragic
Exceptional
17.3%
RECEIVING FOOD STAMPS
0.0/ 100
METRIC RATING
321st/ 347
METRIC RANK
9.9%
RECEIVING FOOD STAMPS
99.0/ 100
METRIC RATING
70th/ 347
METRIC RANK

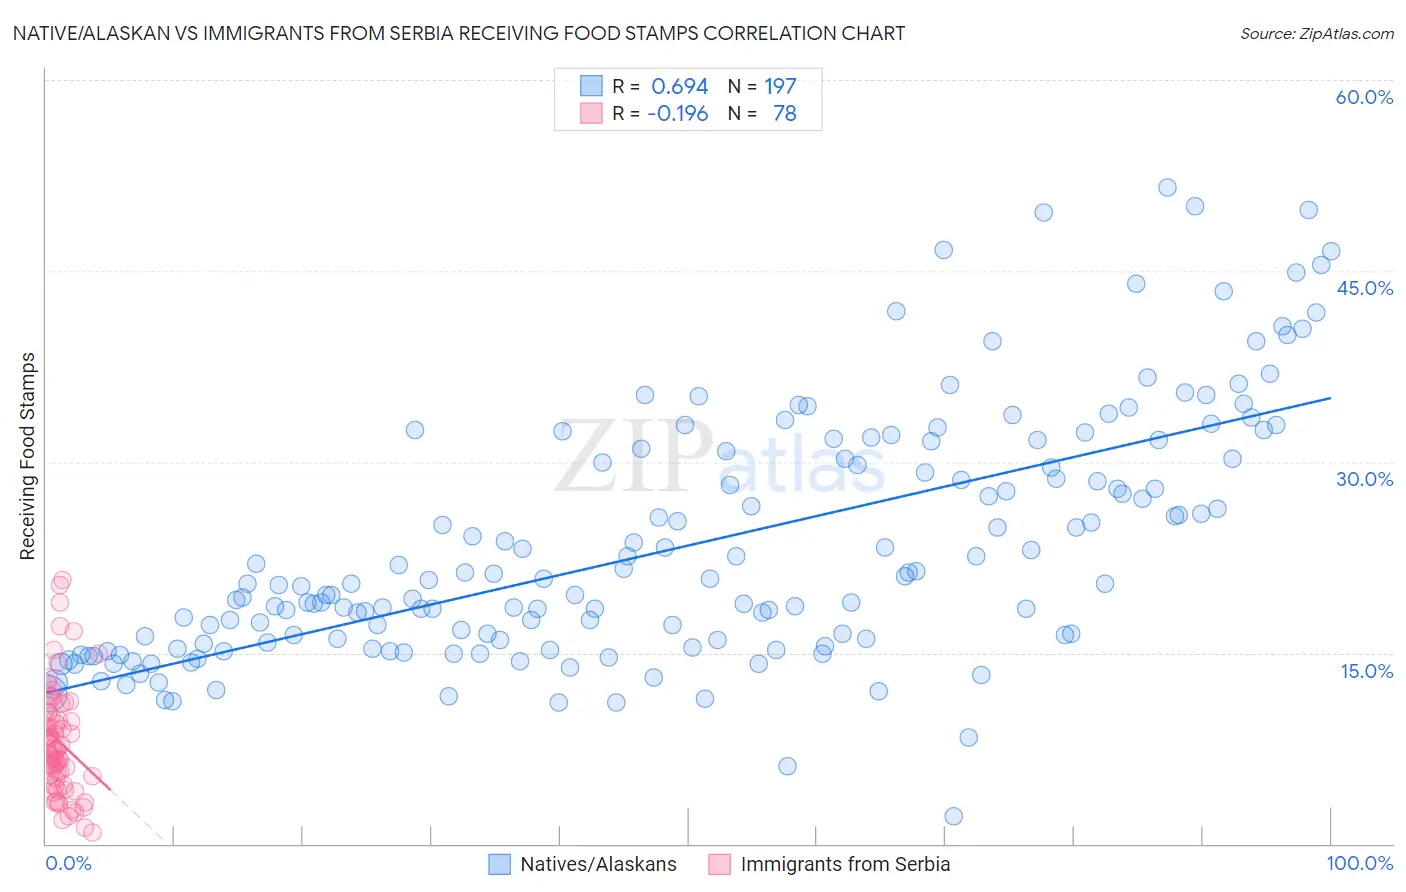
Native/Alaskan vs Immigrants from Serbia Receiving Food Stamps Correlation Chart

The statistical analysis conducted on geographies consisting of 511,480,561 people shows a significant positive correlation between the proportion of Natives/Alaskans and percentage of population receiving government assistance and/or food stamps in the United States with a correlation coefficient (R) of 0.694 and weighted average of 17.3%. Similarly, the statistical analysis conducted on geographies consisting of 131,628,490 people shows a poor negative correlation between the proportion of Immigrants from Serbia and percentage of population receiving government assistance and/or food stamps in the United States with a correlation coefficient (R) of -0.196 and weighted average of 9.9%, a difference of 75.2%.
Native/Alaskan vs Immigrants from Serbia Receiving Food Stamps

Receiving Food Stamps Correlation Summary

MeasurementNative/AlaskanImmigrants from Serbia
Minimum2.2%0.90%
Maximum51.6%20.7%
Range49.4%19.8%
Mean23.4%8.0%
Median20.4%7.3%
Interquartile 25% (IQ1)15.8%5.1%
Interquartile 75% (IQ3)30.5%10.3%
Interquartile Range (IQR)14.7%5.2%
Standard Deviation (Sample)9.7%4.3%
Standard Deviation (Population)9.7%4.3%

Similar Demographics by Receiving Food Stamps

Demographics Similar to Natives/Alaskans by Receiving Food Stamps

In terms of receiving food stamps, the demographic groups most similar to Natives/Alaskans are Immigrants from Nicaragua (17.2%, a difference of 0.18%), Immigrants from St. Vincent and the Grenadines (17.2%, a difference of 0.26%), Menominee (17.2%, a difference of 0.44%), Black/African American (17.2%, a difference of 0.62%), and Central American Indian (17.1%, a difference of 1.1%).
DemographicsRating | RankReceiving Food Stamps
Immigrants | Guyana
0.0
/100
|
#314
Tragic
16.9%
Bahamians
0.0
/100
|
#315
Tragic
17.0%
Central American Indians
0.0
/100
|
#316
Tragic
17.1%
Blacks/African Americans
0.0
/100
|
#317
Tragic
17.2%
Menominee
0.0
/100
|
#318
Tragic
17.2%
Immigrants | St. Vincent and the Grenadines
0.0
/100
|
#319
Tragic
17.2%
Immigrants | Nicaragua
0.0
/100
|
#320
Tragic
17.2%
Natives/Alaskans
0.0
/100
|
#321
Tragic
17.3%
Immigrants | Grenada
0.0
/100
|
#322
Tragic
17.8%
Haitians
0.0
/100
|
#323
Tragic
17.8%
British West Indians
0.0
/100
|
#324
Tragic
17.9%
Immigrants | Haiti
0.0
/100
|
#325
Tragic
18.2%
Cubans
0.0
/100
|
#326
Tragic
18.2%
Apache
0.0
/100
|
#327
Tragic
18.3%
Colville
0.0
/100
|
#328
Tragic
18.3%

Demographics Similar to Immigrants from Serbia by Receiving Food Stamps

In terms of receiving food stamps, the demographic groups most similar to Immigrants from Serbia are Italian (9.9%, a difference of 0.050%), Scottish (9.9%, a difference of 0.13%), Northern European (9.8%, a difference of 0.26%), Immigrants from Indonesia (9.8%, a difference of 0.32%), and Immigrants from Asia (9.9%, a difference of 0.37%).
DemographicsRating | RankReceiving Food Stamps
Chinese
99.2
/100
|
#63
Exceptional
9.8%
Immigrants | North America
99.2
/100
|
#64
Exceptional
9.8%
Immigrants | Turkey
99.1
/100
|
#65
Exceptional
9.8%
Slovenes
99.1
/100
|
#66
Exceptional
9.8%
Immigrants | Indonesia
99.0
/100
|
#67
Exceptional
9.8%
Northern Europeans
99.0
/100
|
#68
Exceptional
9.8%
Italians
99.0
/100
|
#69
Exceptional
9.9%
Immigrants | Serbia
99.0
/100
|
#70
Exceptional
9.9%
Scottish
98.9
/100
|
#71
Exceptional
9.9%
Immigrants | Asia
98.9
/100
|
#72
Exceptional
9.9%
Macedonians
98.9
/100
|
#73
Exceptional
9.9%
New Zealanders
98.8
/100
|
#74
Exceptional
9.9%
Immigrants | Zimbabwe
98.7
/100
|
#75
Exceptional
9.9%
Immigrants | Croatia
98.7
/100
|
#76
Exceptional
10.0%
Immigrants | North Macedonia
98.7
/100
|
#77
Exceptional
10.0%