Nepalese vs Cheyenne Child Poverty Among Boys Under 16
COMPARE
Nepalese
Cheyenne
Child Poverty Among Boys Under 16
Child Poverty Among Boys Under 16 Comparison
Nepalese
Cheyenne
18.0%
CHILD POVERTY AMONG BOYS UNDER 16
3.2/ 100
METRIC RATING
224th/ 347
METRIC RANK
25.8%
CHILD POVERTY AMONG BOYS UNDER 16
0.0/ 100
METRIC RATING
337th/ 347
METRIC RANK
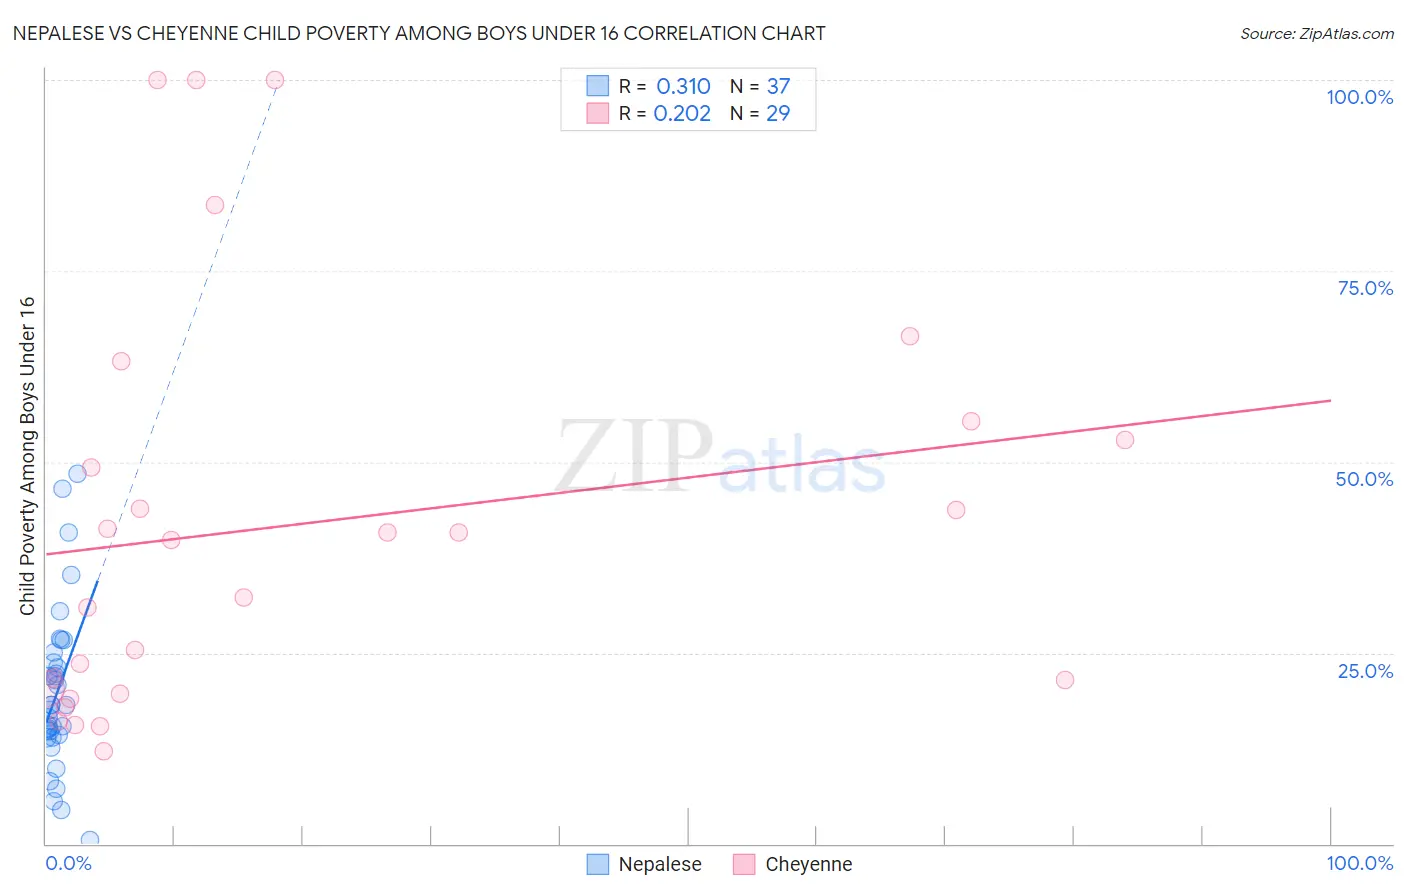
Nepalese vs Cheyenne Child Poverty Among Boys Under 16 Correlation Chart
The statistical analysis conducted on geographies consisting of 24,516,782 people shows a mild positive correlation between the proportion of Nepalese and poverty level among boys under the age of 16 in the United States with a correlation coefficient (R) of 0.310 and weighted average of 18.0%. Similarly, the statistical analysis conducted on geographies consisting of 80,373,873 people shows a weak positive correlation between the proportion of Cheyenne and poverty level among boys under the age of 16 in the United States with a correlation coefficient (R) of 0.202 and weighted average of 25.8%, a difference of 43.4%.
Child Poverty Among Boys Under 16 Correlation Summary
| Measurement | Nepalese | Cheyenne |
| Minimum | 0.48% | 12.2% |
| Maximum | 48.5% | 100.0% |
| Range | 48.0% | 87.8% |
| Mean | 19.8% | 41.8% |
| Median | 18.2% | 39.8% |
| Interquartile 25% (IQ1) | 14.1% | 20.0% |
| Interquartile 75% (IQ3) | 24.4% | 54.1% |
| Interquartile Range (IQR) | 10.3% | 34.1% |
| Standard Deviation (Sample) | 10.6% | 26.7% |
| Standard Deviation (Population) | 10.5% | 26.2% |
Similar Demographics by Child Poverty Among Boys Under 16
Demographics Similar to Nepalese by Child Poverty Among Boys Under 16
In terms of child poverty among boys under 16, the demographic groups most similar to Nepalese are Inupiat (18.1%, a difference of 0.41%), Cuban (17.9%, a difference of 0.47%), Pennsylvania German (17.9%, a difference of 0.56%), Immigrants from Africa (18.1%, a difference of 0.57%), and Bermudan (18.1%, a difference of 0.67%).
| Demographics | Rating | Rank | Child Poverty Among Boys Under 16 |
| Japanese | 5.5 /100 | #217 | Tragic 17.7% |
| Iraqis | 5.5 /100 | #218 | Tragic 17.7% |
| Sierra Leoneans | 5.3 /100 | #219 | Tragic 17.8% |
| Immigrants | Cambodia | 5.1 /100 | #220 | Tragic 17.8% |
| Immigrants | Panama | 4.3 /100 | #221 | Tragic 17.9% |
| Pennsylvania Germans | 3.9 /100 | #222 | Tragic 17.9% |
| Cubans | 3.8 /100 | #223 | Tragic 17.9% |
| Nepalese | 3.2 /100 | #224 | Tragic 18.0% |
| Inupiat | 2.7 /100 | #225 | Tragic 18.1% |
| Immigrants | Africa | 2.6 /100 | #226 | Tragic 18.1% |
| Bermudans | 2.5 /100 | #227 | Tragic 18.1% |
| Immigrants | Nonimmigrants | 2.2 /100 | #228 | Tragic 18.2% |
| Immigrants | Micronesia | 1.8 /100 | #229 | Tragic 18.3% |
| Fijians | 1.8 /100 | #230 | Tragic 18.3% |
| Nicaraguans | 1.4 /100 | #231 | Tragic 18.4% |
Demographics Similar to Cheyenne by Child Poverty Among Boys Under 16
In terms of child poverty among boys under 16, the demographic groups most similar to Cheyenne are Hopi (25.9%, a difference of 0.51%), Houma (26.2%, a difference of 1.5%), Crow (26.3%, a difference of 1.7%), Sioux (25.3%, a difference of 2.0%), and Yup'ik (24.7%, a difference of 4.4%).
| Demographics | Rating | Rank | Child Poverty Among Boys Under 16 |
| Colville | 0.0 /100 | #330 | Tragic 24.1% |
| Dominicans | 0.0 /100 | #331 | Tragic 24.2% |
| Immigrants | Dominican Republic | 0.0 /100 | #332 | Tragic 24.3% |
| Apache | 0.0 /100 | #333 | Tragic 24.5% |
| Blacks/African Americans | 0.0 /100 | #334 | Tragic 24.5% |
| Yup'ik | 0.0 /100 | #335 | Tragic 24.7% |
| Sioux | 0.0 /100 | #336 | Tragic 25.3% |
| Cheyenne | 0.0 /100 | #337 | Tragic 25.8% |
| Hopi | 0.0 /100 | #338 | Tragic 25.9% |
| Houma | 0.0 /100 | #339 | Tragic 26.2% |
| Crow | 0.0 /100 | #340 | Tragic 26.3% |
| Immigrants | Yemen | 0.0 /100 | #341 | Tragic 28.9% |
| Pima | 0.0 /100 | #342 | Tragic 29.7% |
| Navajo | 0.0 /100 | #343 | Tragic 30.3% |
| Yuman | 0.0 /100 | #344 | Tragic 30.6% |