Native/Alaskan vs Cheyenne Unemployment Among Ages 35 to 44 years
COMPARE
Native/Alaskan
Cheyenne
Unemployment Among Ages 35 to 44 years
Unemployment Among Ages 35 to 44 years Comparison
Natives/Alaskans
Cheyenne
7.3%
UNEMPLOYMENT AMONG AGES 35 TO 44 YEARS
0.0/ 100
METRIC RATING
332nd/ 347
METRIC RANK
8.5%
UNEMPLOYMENT AMONG AGES 35 TO 44 YEARS
0.0/ 100
METRIC RATING
338th/ 347
METRIC RANK
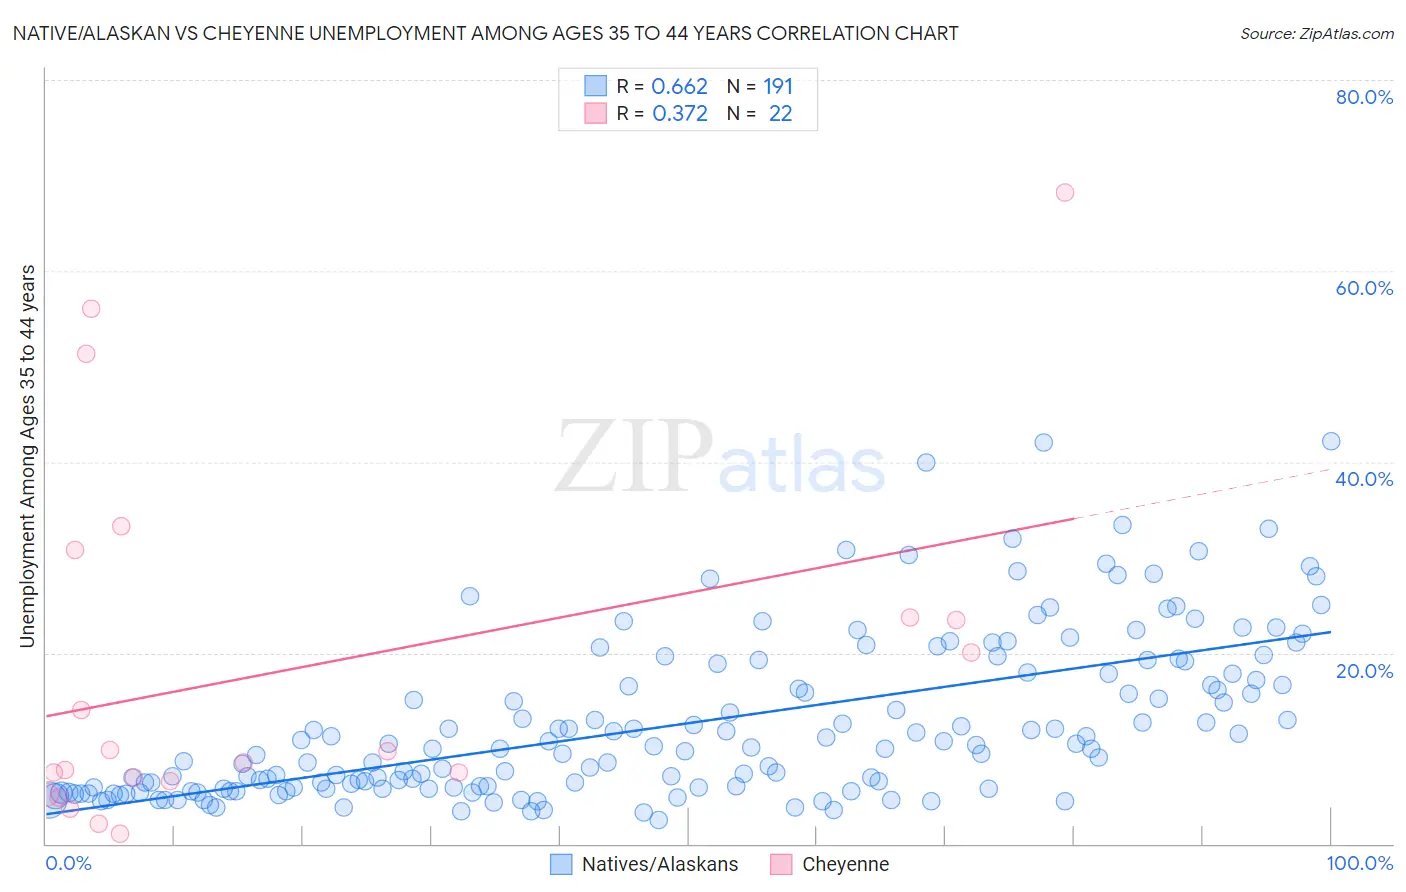
Native/Alaskan vs Cheyenne Unemployment Among Ages 35 to 44 years Correlation Chart
The statistical analysis conducted on geographies consisting of 490,779,782 people shows a significant positive correlation between the proportion of Natives/Alaskans and unemployment rate among population between the ages 35 and 44 in the United States with a correlation coefficient (R) of 0.662 and weighted average of 7.3%. Similarly, the statistical analysis conducted on geographies consisting of 80,033,821 people shows a mild positive correlation between the proportion of Cheyenne and unemployment rate among population between the ages 35 and 44 in the United States with a correlation coefficient (R) of 0.372 and weighted average of 8.5%, a difference of 16.9%.
Unemployment Among Ages 35 to 44 years Correlation Summary
| Measurement | Native/Alaskan | Cheyenne |
| Minimum | 2.5% | 1.0% |
| Maximum | 42.2% | 68.2% |
| Range | 39.7% | 67.2% |
| Mean | 12.6% | 18.3% |
| Median | 10.0% | 9.1% |
| Interquartile 25% (IQ1) | 5.8% | 6.5% |
| Interquartile 75% (IQ3) | 17.9% | 23.7% |
| Interquartile Range (IQR) | 12.0% | 17.2% |
| Standard Deviation (Sample) | 8.5% | 18.8% |
| Standard Deviation (Population) | 8.5% | 18.4% |
Demographics Similar to Natives/Alaskans and Cheyenne by Unemployment Among Ages 35 to 44 years
In terms of unemployment among ages 35 to 44 years, the demographic groups most similar to Natives/Alaskans are Pueblo (7.1%, a difference of 2.9%), Puerto Rican (7.6%, a difference of 5.2%), Immigrants from Cabo Verde (6.9%, a difference of 5.5%), Paiute (6.9%, a difference of 5.5%), and Houma (7.8%, a difference of 8.0%). Similarly, the demographic groups most similar to Cheyenne are Tohono O'odham (8.4%, a difference of 0.51%), Apache (8.4%, a difference of 0.87%), Inupiat (8.6%, a difference of 1.1%), Sioux (8.4%, a difference of 1.2%), and Alaskan Athabascan (8.6%, a difference of 1.8%).
| Demographics | Rating | Rank | Unemployment Among Ages 35 to 44 years |
| Immigrants | Yemen | 0.0 /100 | #325 | Tragic 6.6% |
| Alaska Natives | 0.0 /100 | #326 | Tragic 6.6% |
| Cape Verdeans | 0.0 /100 | #327 | Tragic 6.6% |
| Shoshone | 0.0 /100 | #328 | Tragic 6.6% |
| Paiute | 0.0 /100 | #329 | Tragic 6.9% |
| Immigrants | Cabo Verde | 0.0 /100 | #330 | Tragic 6.9% |
| Pueblo | 0.0 /100 | #331 | Tragic 7.1% |
| Natives/Alaskans | 0.0 /100 | #332 | Tragic 7.3% |
| Puerto Ricans | 0.0 /100 | #333 | Tragic 7.6% |
| Houma | 0.0 /100 | #334 | Tragic 7.8% |
| Sioux | 0.0 /100 | #335 | Tragic 8.4% |
| Apache | 0.0 /100 | #336 | Tragic 8.4% |
| Tohono O'odham | 0.0 /100 | #337 | Tragic 8.4% |
| Cheyenne | 0.0 /100 | #338 | Tragic 8.5% |
| Inupiat | 0.0 /100 | #339 | Tragic 8.6% |
| Alaskan Athabascans | 0.0 /100 | #340 | Tragic 8.6% |
| Hopi | 0.0 /100 | #341 | Tragic 8.9% |
| Navajo | 0.0 /100 | #342 | Tragic 9.3% |
| Arapaho | 0.0 /100 | #343 | Tragic 10.3% |
| Pima | 0.0 /100 | #344 | Tragic 11.8% |
| Yup'ik | 0.0 /100 | #345 | Tragic 14.4% |