Romanian vs West Indian Seniors Poverty Over the Age of 65
COMPARE
Romanian
West Indian
Seniors Poverty Over the Age of 65
Seniors Poverty Over the Age of 65 Comparison
Romanians
West Indians
10.1%
SENIORS POVERTY OVER THE AGE OF 65
97.2/ 100
METRIC RATING
86th/ 347
METRIC RANK
14.1%
SENIORS POVERTY OVER THE AGE OF 65
0.0/ 100
METRIC RATING
304th/ 347
METRIC RANK
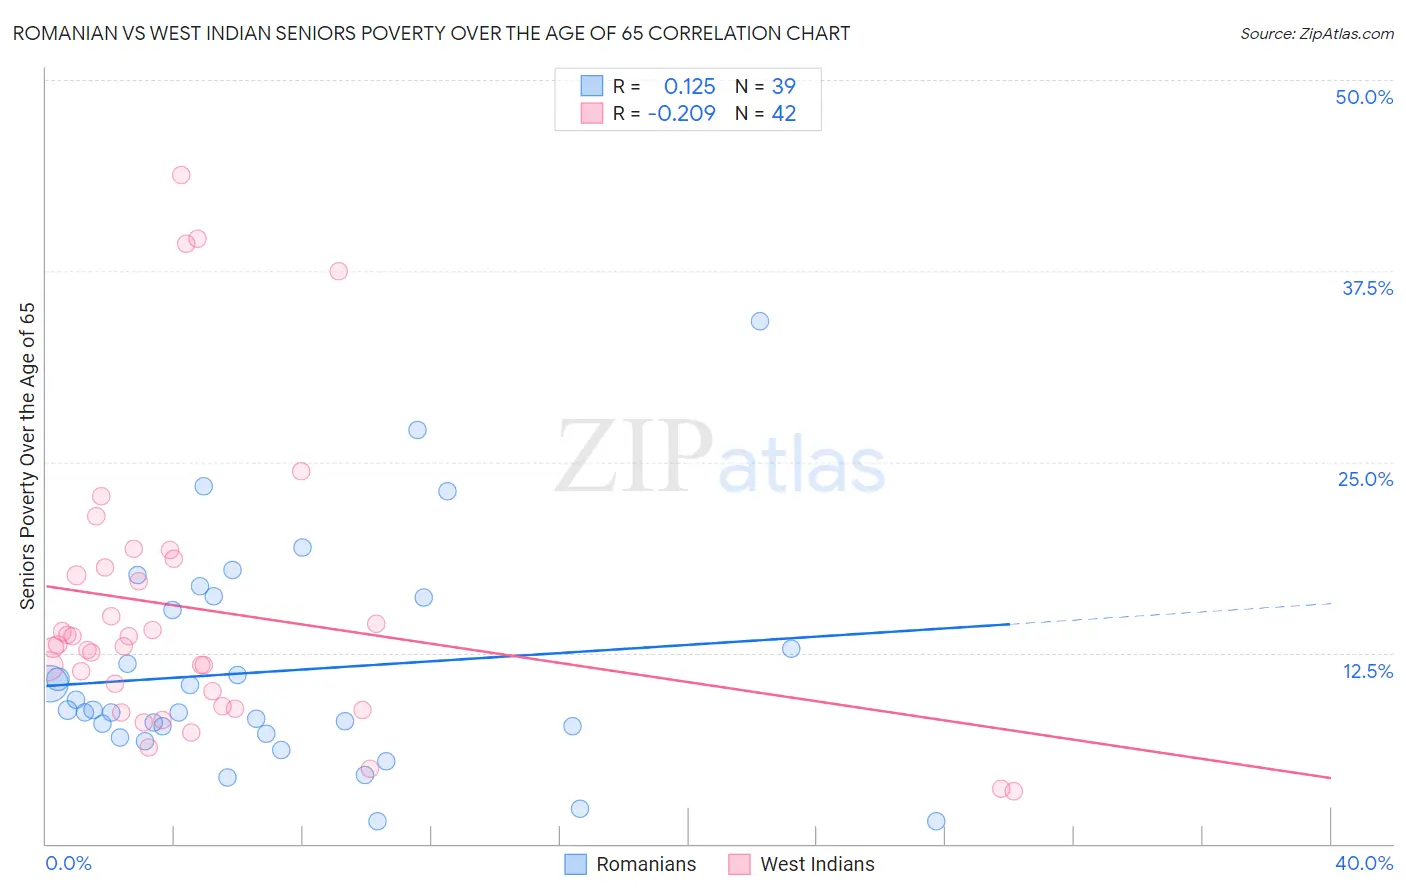
Romanian vs West Indian Seniors Poverty Over the Age of 65 Correlation Chart
The statistical analysis conducted on geographies consisting of 376,686,002 people shows a poor positive correlation between the proportion of Romanians and poverty level among seniors over the age of 65 in the United States with a correlation coefficient (R) of 0.125 and weighted average of 10.1%. Similarly, the statistical analysis conducted on geographies consisting of 253,356,743 people shows a weak negative correlation between the proportion of West Indians and poverty level among seniors over the age of 65 in the United States with a correlation coefficient (R) of -0.209 and weighted average of 14.1%, a difference of 40.0%.
Seniors Poverty Over the Age of 65 Correlation Summary
| Measurement | Romanian | West Indian |
| Minimum | 1.4% | 3.4% |
| Maximum | 34.2% | 43.8% |
| Range | 32.7% | 40.3% |
| Mean | 11.3% | 15.3% |
| Median | 8.7% | 13.0% |
| Interquartile 25% (IQ1) | 7.2% | 9.0% |
| Interquartile 75% (IQ3) | 16.1% | 18.1% |
| Interquartile Range (IQR) | 8.9% | 9.1% |
| Standard Deviation (Sample) | 7.1% | 9.5% |
| Standard Deviation (Population) | 7.0% | 9.3% |
Similar Demographics by Seniors Poverty Over the Age of 65
Demographics Similar to Romanians by Seniors Poverty Over the Age of 65
In terms of seniors poverty over the age of 65, the demographic groups most similar to Romanians are Immigrants from Afghanistan (10.1%, a difference of 0.020%), Immigrants from Nepal (10.1%, a difference of 0.020%), Burmese (10.1%, a difference of 0.020%), Immigrants from Poland (10.1%, a difference of 0.050%), and Immigrants from Bolivia (10.1%, a difference of 0.070%).
| Demographics | Rating | Rank | Seniors Poverty Over the Age of 65 |
| Immigrants | Ireland | 97.5 /100 | #79 | Exceptional 10.0% |
| Koreans | 97.4 /100 | #80 | Exceptional 10.1% |
| Immigrants | Sri Lanka | 97.3 /100 | #81 | Exceptional 10.1% |
| Immigrants | Bolivia | 97.3 /100 | #82 | Exceptional 10.1% |
| Immigrants | Poland | 97.2 /100 | #83 | Exceptional 10.1% |
| Immigrants | Afghanistan | 97.2 /100 | #84 | Exceptional 10.1% |
| Immigrants | Nepal | 97.2 /100 | #85 | Exceptional 10.1% |
| Romanians | 97.2 /100 | #86 | Exceptional 10.1% |
| Burmese | 97.2 /100 | #87 | Exceptional 10.1% |
| Jordanians | 97.1 /100 | #88 | Exceptional 10.1% |
| Immigrants | Bulgaria | 97.0 /100 | #89 | Exceptional 10.1% |
| Ukrainians | 96.9 /100 | #90 | Exceptional 10.1% |
| Puget Sound Salish | 96.9 /100 | #91 | Exceptional 10.1% |
| Immigrants | Singapore | 96.9 /100 | #92 | Exceptional 10.1% |
| Immigrants | Sweden | 96.7 /100 | #93 | Exceptional 10.1% |
Demographics Similar to West Indians by Seniors Poverty Over the Age of 65
In terms of seniors poverty over the age of 65, the demographic groups most similar to West Indians are Immigrants from Trinidad and Tobago (14.1%, a difference of 0.060%), Immigrants from Bangladesh (14.1%, a difference of 0.24%), Yup'ik (14.1%, a difference of 0.35%), Immigrants from Latin America (14.2%, a difference of 0.36%), and U.S. Virgin Islander (14.0%, a difference of 0.43%).
| Demographics | Rating | Rank | Seniors Poverty Over the Age of 65 |
| Vietnamese | 0.0 /100 | #297 | Tragic 14.0% |
| Immigrants | Belize | 0.0 /100 | #298 | Tragic 14.0% |
| Ecuadorians | 0.0 /100 | #299 | Tragic 14.0% |
| Immigrants | Uzbekistan | 0.0 /100 | #300 | Tragic 14.0% |
| U.S. Virgin Islanders | 0.0 /100 | #301 | Tragic 14.0% |
| Yup'ik | 0.0 /100 | #302 | Tragic 14.1% |
| Immigrants | Bangladesh | 0.0 /100 | #303 | Tragic 14.1% |
| West Indians | 0.0 /100 | #304 | Tragic 14.1% |
| Immigrants | Trinidad and Tobago | 0.0 /100 | #305 | Tragic 14.1% |
| Immigrants | Latin America | 0.0 /100 | #306 | Tragic 14.2% |
| Immigrants | West Indies | 0.0 /100 | #307 | Tragic 14.2% |
| Trinidadians and Tobagonians | 0.0 /100 | #308 | Tragic 14.2% |
| Hondurans | 0.0 /100 | #309 | Tragic 14.2% |
| Bahamians | 0.0 /100 | #310 | Tragic 14.2% |
| Natives/Alaskans | 0.0 /100 | #311 | Tragic 14.2% |