Native Hawaiian vs Croatian Seniors Poverty Over the Age of 65
COMPARE
Native Hawaiian
Croatian
Seniors Poverty Over the Age of 65
Seniors Poverty Over the Age of 65 Comparison
Native Hawaiians
Croatians
9.4%
SENIORS POVERTY OVER THE AGE OF 65
99.8/ 100
METRIC RATING
33rd/ 347
METRIC RANK
9.1%
SENIORS POVERTY OVER THE AGE OF 65
99.9/ 100
METRIC RATING
13th/ 347
METRIC RANK
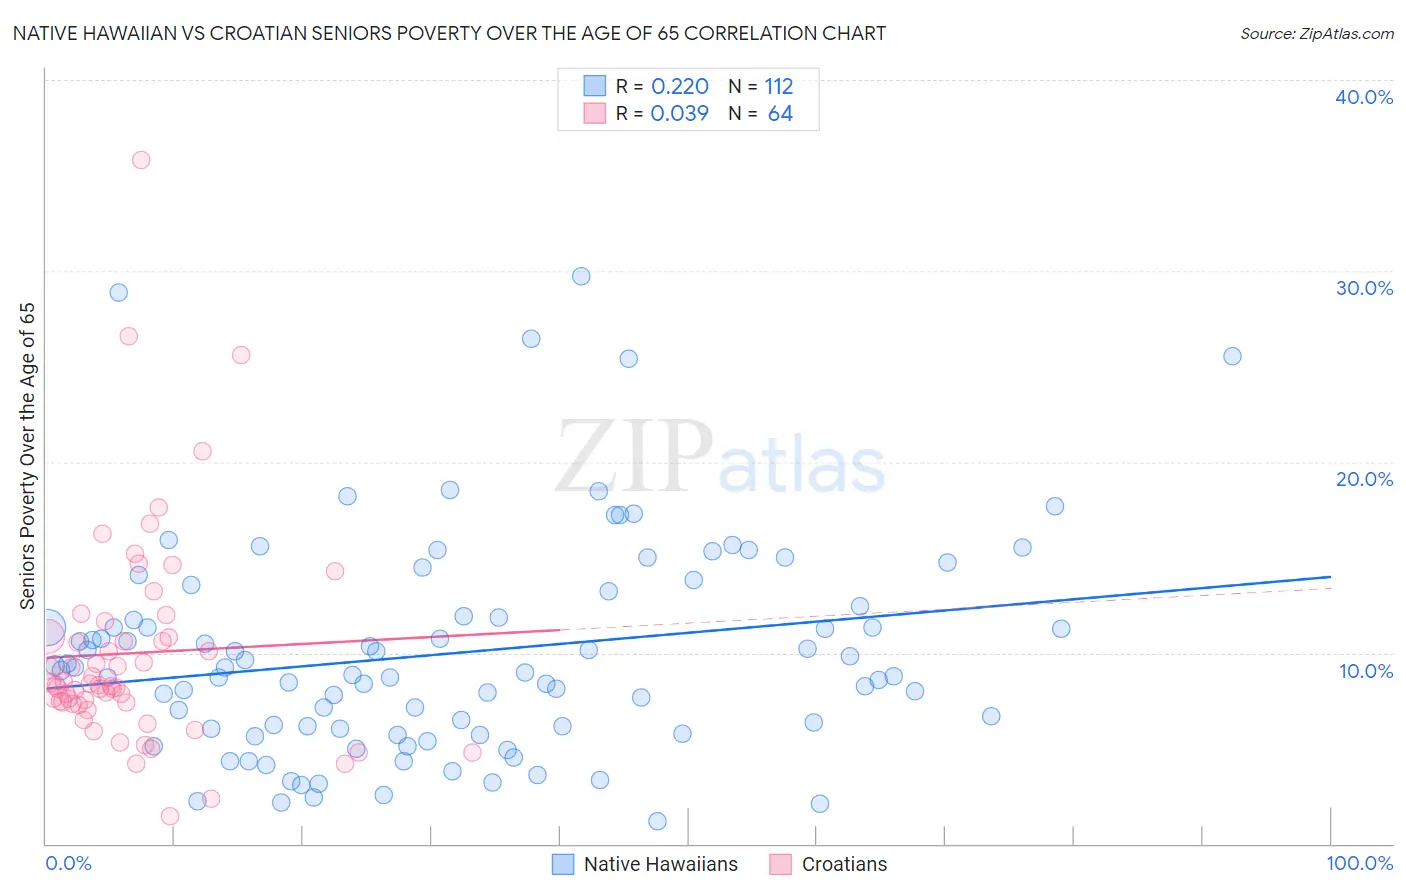
Native Hawaiian vs Croatian Seniors Poverty Over the Age of 65 Correlation Chart
The statistical analysis conducted on geographies consisting of 330,714,575 people shows a weak positive correlation between the proportion of Native Hawaiians and poverty level among seniors over the age of 65 in the United States with a correlation coefficient (R) of 0.220 and weighted average of 9.4%. Similarly, the statistical analysis conducted on geographies consisting of 374,546,245 people shows no correlation between the proportion of Croatians and poverty level among seniors over the age of 65 in the United States with a correlation coefficient (R) of 0.039 and weighted average of 9.1%, a difference of 3.1%.
Seniors Poverty Over the Age of 65 Correlation Summary
| Measurement | Native Hawaiian | Croatian |
| Minimum | 1.2% | 1.4% |
| Maximum | 29.8% | 35.8% |
| Range | 28.6% | 34.4% |
| Mean | 10.0% | 10.0% |
| Median | 9.0% | 8.3% |
| Interquartile 25% (IQ1) | 6.0% | 7.4% |
| Interquartile 75% (IQ3) | 12.2% | 10.8% |
| Interquartile Range (IQR) | 6.1% | 3.5% |
| Standard Deviation (Sample) | 5.7% | 5.7% |
| Standard Deviation (Population) | 5.6% | 5.7% |
Demographics Similar to Native Hawaiians and Croatians by Seniors Poverty Over the Age of 65
In terms of seniors poverty over the age of 65, the demographic groups most similar to Native Hawaiians are Northern European (9.4%, a difference of 0.020%), Finnish (9.4%, a difference of 0.30%), Menominee (9.4%, a difference of 0.52%), Bhutanese (9.3%, a difference of 0.68%), and Tongan (9.3%, a difference of 1.0%). Similarly, the demographic groups most similar to Croatians are Polish (9.1%, a difference of 0.030%), Dutch (9.1%, a difference of 0.10%), European (9.2%, a difference of 0.47%), Scottish (9.2%, a difference of 0.58%), and Slovak (9.2%, a difference of 0.61%).
| Demographics | Rating | Rank | Seniors Poverty Over the Age of 65 |
| Croatians | 99.9 /100 | #13 | Exceptional 9.1% |
| Poles | 99.9 /100 | #14 | Exceptional 9.1% |
| Dutch | 99.9 /100 | #15 | Exceptional 9.1% |
| Europeans | 99.9 /100 | #16 | Exceptional 9.2% |
| Scottish | 99.9 /100 | #17 | Exceptional 9.2% |
| Slovaks | 99.9 /100 | #18 | Exceptional 9.2% |
| Swiss | 99.9 /100 | #19 | Exceptional 9.2% |
| Thais | 99.9 /100 | #20 | Exceptional 9.2% |
| Luxembourgers | 99.9 /100 | #21 | Exceptional 9.2% |
| Slovenes | 99.9 /100 | #22 | Exceptional 9.3% |
| Welsh | 99.9 /100 | #23 | Exceptional 9.3% |
| Bulgarians | 99.9 /100 | #24 | Exceptional 9.3% |
| Irish | 99.9 /100 | #25 | Exceptional 9.3% |
| Immigrants | Scotland | 99.9 /100 | #26 | Exceptional 9.3% |
| Italians | 99.9 /100 | #27 | Exceptional 9.3% |
| Tongans | 99.9 /100 | #28 | Exceptional 9.3% |
| Bhutanese | 99.9 /100 | #29 | Exceptional 9.3% |
| Menominee | 99.8 /100 | #30 | Exceptional 9.4% |
| Finns | 99.8 /100 | #31 | Exceptional 9.4% |
| Northern Europeans | 99.8 /100 | #32 | Exceptional 9.4% |
| Native Hawaiians | 99.8 /100 | #33 | Exceptional 9.4% |