Native Hawaiian vs Jordanian Seniors Poverty Over the Age of 65
COMPARE
Native Hawaiian
Jordanian
Seniors Poverty Over the Age of 65
Seniors Poverty Over the Age of 65 Comparison
Native Hawaiians
Jordanians
9.4%
SENIORS POVERTY OVER THE AGE OF 65
99.8/ 100
METRIC RATING
33rd/ 347
METRIC RANK
10.1%
SENIORS POVERTY OVER THE AGE OF 65
97.1/ 100
METRIC RATING
88th/ 347
METRIC RANK
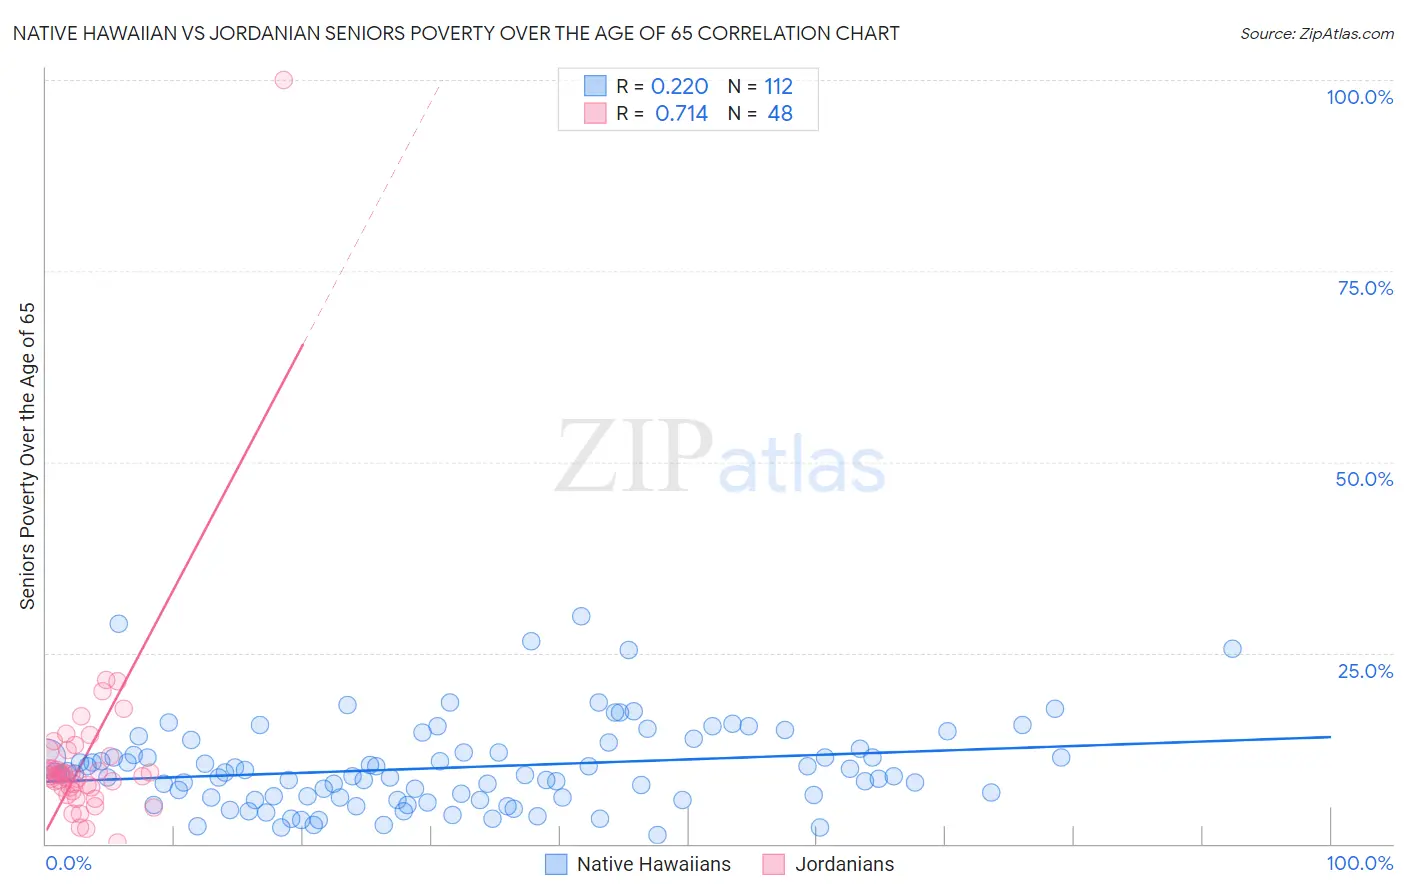
Native Hawaiian vs Jordanian Seniors Poverty Over the Age of 65 Correlation Chart
The statistical analysis conducted on geographies consisting of 330,714,575 people shows a weak positive correlation between the proportion of Native Hawaiians and poverty level among seniors over the age of 65 in the United States with a correlation coefficient (R) of 0.220 and weighted average of 9.4%. Similarly, the statistical analysis conducted on geographies consisting of 166,299,913 people shows a strong positive correlation between the proportion of Jordanians and poverty level among seniors over the age of 65 in the United States with a correlation coefficient (R) of 0.714 and weighted average of 10.1%, a difference of 7.1%.
Seniors Poverty Over the Age of 65 Correlation Summary
| Measurement | Native Hawaiian | Jordanian |
| Minimum | 1.2% | 0.093% |
| Maximum | 29.8% | 100.0% |
| Range | 28.6% | 99.9% |
| Mean | 10.0% | 11.3% |
| Median | 9.0% | 9.0% |
| Interquartile 25% (IQ1) | 6.0% | 7.3% |
| Interquartile 75% (IQ3) | 12.2% | 11.7% |
| Interquartile Range (IQR) | 6.1% | 4.4% |
| Standard Deviation (Sample) | 5.7% | 13.8% |
| Standard Deviation (Population) | 5.6% | 13.7% |
Similar Demographics by Seniors Poverty Over the Age of 65
Demographics Similar to Native Hawaiians by Seniors Poverty Over the Age of 65
In terms of seniors poverty over the age of 65, the demographic groups most similar to Native Hawaiians are Northern European (9.4%, a difference of 0.020%), British (9.4%, a difference of 0.10%), Finnish (9.4%, a difference of 0.30%), Latvian (9.5%, a difference of 0.48%), and Menominee (9.4%, a difference of 0.52%).
| Demographics | Rating | Rank | Seniors Poverty Over the Age of 65 |
| Immigrants | Scotland | 99.9 /100 | #26 | Exceptional 9.3% |
| Italians | 99.9 /100 | #27 | Exceptional 9.3% |
| Tongans | 99.9 /100 | #28 | Exceptional 9.3% |
| Bhutanese | 99.9 /100 | #29 | Exceptional 9.3% |
| Menominee | 99.8 /100 | #30 | Exceptional 9.4% |
| Finns | 99.8 /100 | #31 | Exceptional 9.4% |
| Northern Europeans | 99.8 /100 | #32 | Exceptional 9.4% |
| Native Hawaiians | 99.8 /100 | #33 | Exceptional 9.4% |
| British | 99.8 /100 | #34 | Exceptional 9.4% |
| Latvians | 99.8 /100 | #35 | Exceptional 9.5% |
| Czechoslovakians | 99.8 /100 | #36 | Exceptional 9.5% |
| Scotch-Irish | 99.7 /100 | #37 | Exceptional 9.5% |
| Belgians | 99.7 /100 | #38 | Exceptional 9.5% |
| Greeks | 99.6 /100 | #39 | Exceptional 9.6% |
| Assyrians/Chaldeans/Syriacs | 99.6 /100 | #40 | Exceptional 9.6% |
Demographics Similar to Jordanians by Seniors Poverty Over the Age of 65
In terms of seniors poverty over the age of 65, the demographic groups most similar to Jordanians are Burmese (10.1%, a difference of 0.050%), Romanian (10.1%, a difference of 0.070%), Immigrants from Bulgaria (10.1%, a difference of 0.080%), Immigrants from Afghanistan (10.1%, a difference of 0.090%), and Immigrants from Nepal (10.1%, a difference of 0.090%).
| Demographics | Rating | Rank | Seniors Poverty Over the Age of 65 |
| Immigrants | Sri Lanka | 97.3 /100 | #81 | Exceptional 10.1% |
| Immigrants | Bolivia | 97.3 /100 | #82 | Exceptional 10.1% |
| Immigrants | Poland | 97.2 /100 | #83 | Exceptional 10.1% |
| Immigrants | Afghanistan | 97.2 /100 | #84 | Exceptional 10.1% |
| Immigrants | Nepal | 97.2 /100 | #85 | Exceptional 10.1% |
| Romanians | 97.2 /100 | #86 | Exceptional 10.1% |
| Burmese | 97.2 /100 | #87 | Exceptional 10.1% |
| Jordanians | 97.1 /100 | #88 | Exceptional 10.1% |
| Immigrants | Bulgaria | 97.0 /100 | #89 | Exceptional 10.1% |
| Ukrainians | 96.9 /100 | #90 | Exceptional 10.1% |
| Puget Sound Salish | 96.9 /100 | #91 | Exceptional 10.1% |
| Immigrants | Singapore | 96.9 /100 | #92 | Exceptional 10.1% |
| Immigrants | Sweden | 96.7 /100 | #93 | Exceptional 10.1% |
| Immigrants | Germany | 96.7 /100 | #94 | Exceptional 10.1% |
| Immigrants | Japan | 96.3 /100 | #95 | Exceptional 10.1% |