British vs Immigrants from Iran Child Poverty Under the Age of 5
COMPARE
British
Immigrants from Iran
Child Poverty Under the Age of 5
Child Poverty Under the Age of 5 Comparison
British
Immigrants from Iran
16.3%
CHILD POVERTY UNDER THE AGE OF 5
89.4/ 100
METRIC RATING
129th/ 347
METRIC RANK
13.1%
CHILD POVERTY UNDER THE AGE OF 5
100.0/ 100
METRIC RATING
9th/ 347
METRIC RANK
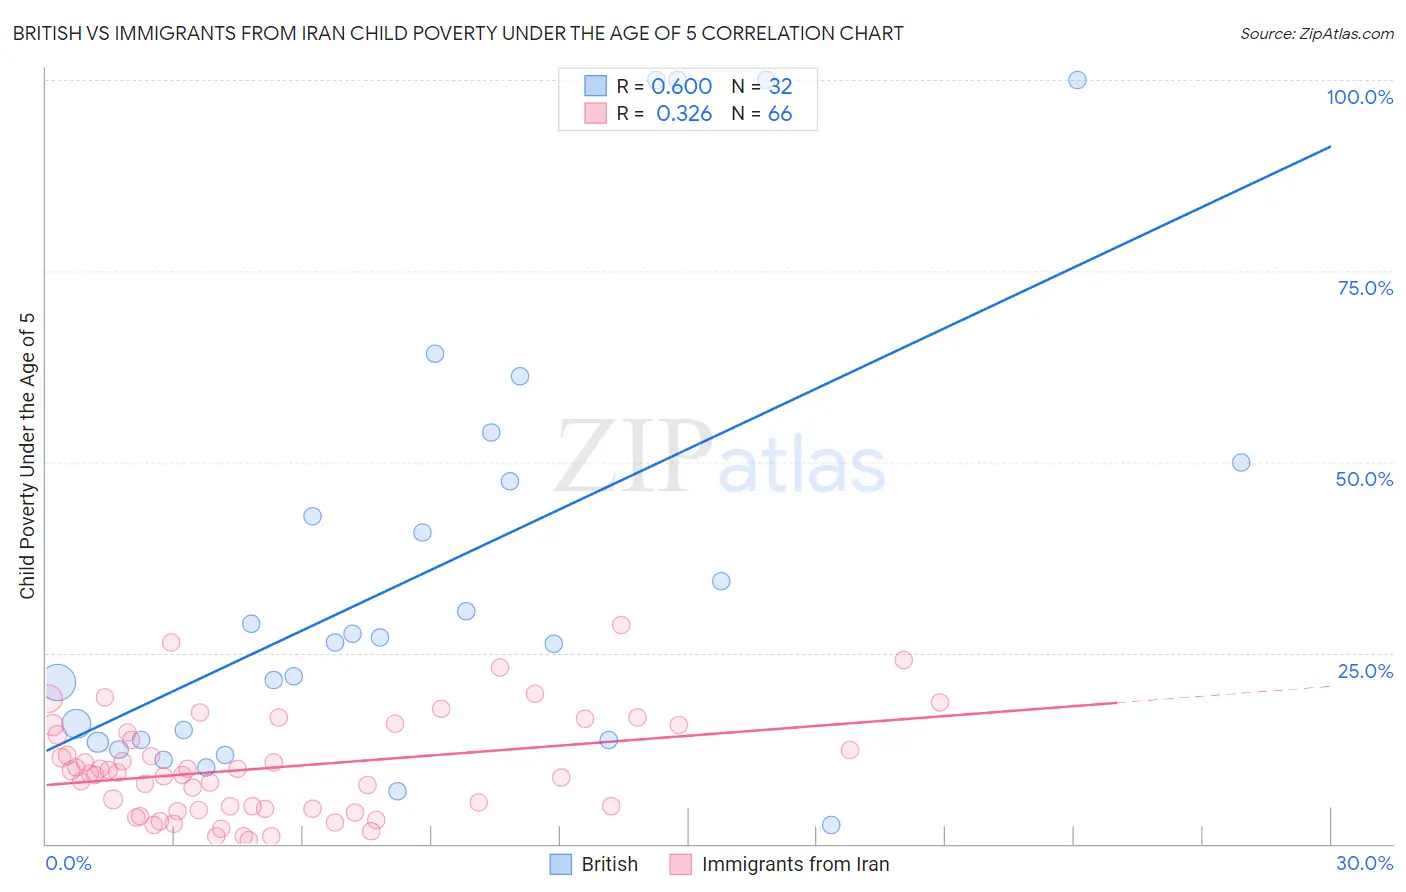
British vs Immigrants from Iran Child Poverty Under the Age of 5 Correlation Chart
The statistical analysis conducted on geographies consisting of 499,115,764 people shows a substantial positive correlation between the proportion of British and poverty level among children under the age of 5 in the United States with a correlation coefficient (R) of 0.600 and weighted average of 16.3%. Similarly, the statistical analysis conducted on geographies consisting of 269,372,648 people shows a mild positive correlation between the proportion of Immigrants from Iran and poverty level among children under the age of 5 in the United States with a correlation coefficient (R) of 0.326 and weighted average of 13.1%, a difference of 24.4%.
Child Poverty Under the Age of 5 Correlation Summary
| Measurement | British | Immigrants from Iran |
| Minimum | 2.4% | 0.42% |
| Maximum | 100.0% | 28.6% |
| Range | 97.6% | 28.2% |
| Mean | 36.0% | 10.0% |
| Median | 26.7% | 9.3% |
| Interquartile 25% (IQ1) | 13.6% | 4.6% |
| Interquartile 75% (IQ3) | 48.7% | 14.6% |
| Interquartile Range (IQR) | 35.1% | 10.0% |
| Standard Deviation (Sample) | 29.2% | 6.6% |
| Standard Deviation (Population) | 28.7% | 6.5% |
Similar Demographics by Child Poverty Under the Age of 5
Demographics Similar to British by Child Poverty Under the Age of 5
In terms of child poverty under the age of 5, the demographic groups most similar to British are Immigrants from Norway (16.3%, a difference of 0.030%), South African (16.2%, a difference of 0.18%), Finnish (16.3%, a difference of 0.32%), Serbian (16.3%, a difference of 0.35%), and Icelander (16.3%, a difference of 0.42%).
| Demographics | Rating | Rank | Child Poverty Under the Age of 5 |
| Immigrants | Southern Europe | 92.0 /100 | #122 | Exceptional 16.1% |
| Austrians | 92.0 /100 | #123 | Exceptional 16.1% |
| Swiss | 92.0 /100 | #124 | Exceptional 16.1% |
| Native Hawaiians | 91.8 /100 | #125 | Exceptional 16.2% |
| Immigrants | Albania | 91.8 /100 | #126 | Exceptional 16.2% |
| Immigrants | England | 91.5 /100 | #127 | Exceptional 16.2% |
| South Africans | 90.1 /100 | #128 | Exceptional 16.2% |
| British | 89.4 /100 | #129 | Excellent 16.3% |
| Immigrants | Norway | 89.3 /100 | #130 | Excellent 16.3% |
| Finns | 88.3 /100 | #131 | Excellent 16.3% |
| Serbians | 88.2 /100 | #132 | Excellent 16.3% |
| Icelanders | 87.9 /100 | #133 | Excellent 16.3% |
| Immigrants | North Macedonia | 87.8 /100 | #134 | Excellent 16.4% |
| Brazilians | 87.8 /100 | #135 | Excellent 16.4% |
| Immigrants | Northern Africa | 87.5 /100 | #136 | Excellent 16.4% |
Demographics Similar to Immigrants from Iran by Child Poverty Under the Age of 5
In terms of child poverty under the age of 5, the demographic groups most similar to Immigrants from Iran are Iranian (13.1%, a difference of 0.16%), Chinese (13.1%, a difference of 0.17%), Burmese (13.2%, a difference of 1.1%), Immigrants from Singapore (12.9%, a difference of 1.2%), and Immigrants from Korea (13.2%, a difference of 1.2%).
| Demographics | Rating | Rank | Child Poverty Under the Age of 5 |
| Immigrants | Taiwan | 100.0 /100 | #2 | Exceptional 11.6% |
| Filipinos | 100.0 /100 | #3 | Exceptional 11.6% |
| Thais | 100.0 /100 | #4 | Exceptional 12.3% |
| Immigrants | Hong Kong | 100.0 /100 | #5 | Exceptional 12.4% |
| Immigrants | Singapore | 100.0 /100 | #6 | Exceptional 12.9% |
| Chinese | 100.0 /100 | #7 | Exceptional 13.1% |
| Iranians | 100.0 /100 | #8 | Exceptional 13.1% |
| Immigrants | Iran | 100.0 /100 | #9 | Exceptional 13.1% |
| Burmese | 100.0 /100 | #10 | Exceptional 13.2% |
| Immigrants | Korea | 100.0 /100 | #11 | Exceptional 13.2% |
| Immigrants | South Central Asia | 100.0 /100 | #12 | Exceptional 13.3% |
| Bhutanese | 100.0 /100 | #13 | Exceptional 13.4% |
| Okinawans | 100.0 /100 | #14 | Exceptional 13.4% |
| Indians (Asian) | 100.0 /100 | #15 | Exceptional 13.4% |
| Immigrants | Eastern Asia | 100.0 /100 | #16 | Exceptional 13.5% |