Moroccan vs Immigrants from Morocco 8th Grade
COMPARE
Moroccan
Immigrants from Morocco
8th Grade
8th Grade Comparison
Moroccans
Immigrants from Morocco
95.5%
8TH GRADE
17.4/ 100
METRIC RATING
203rd/ 347
METRIC RANK
95.4%
8TH GRADE
12.4/ 100
METRIC RATING
211th/ 347
METRIC RANK
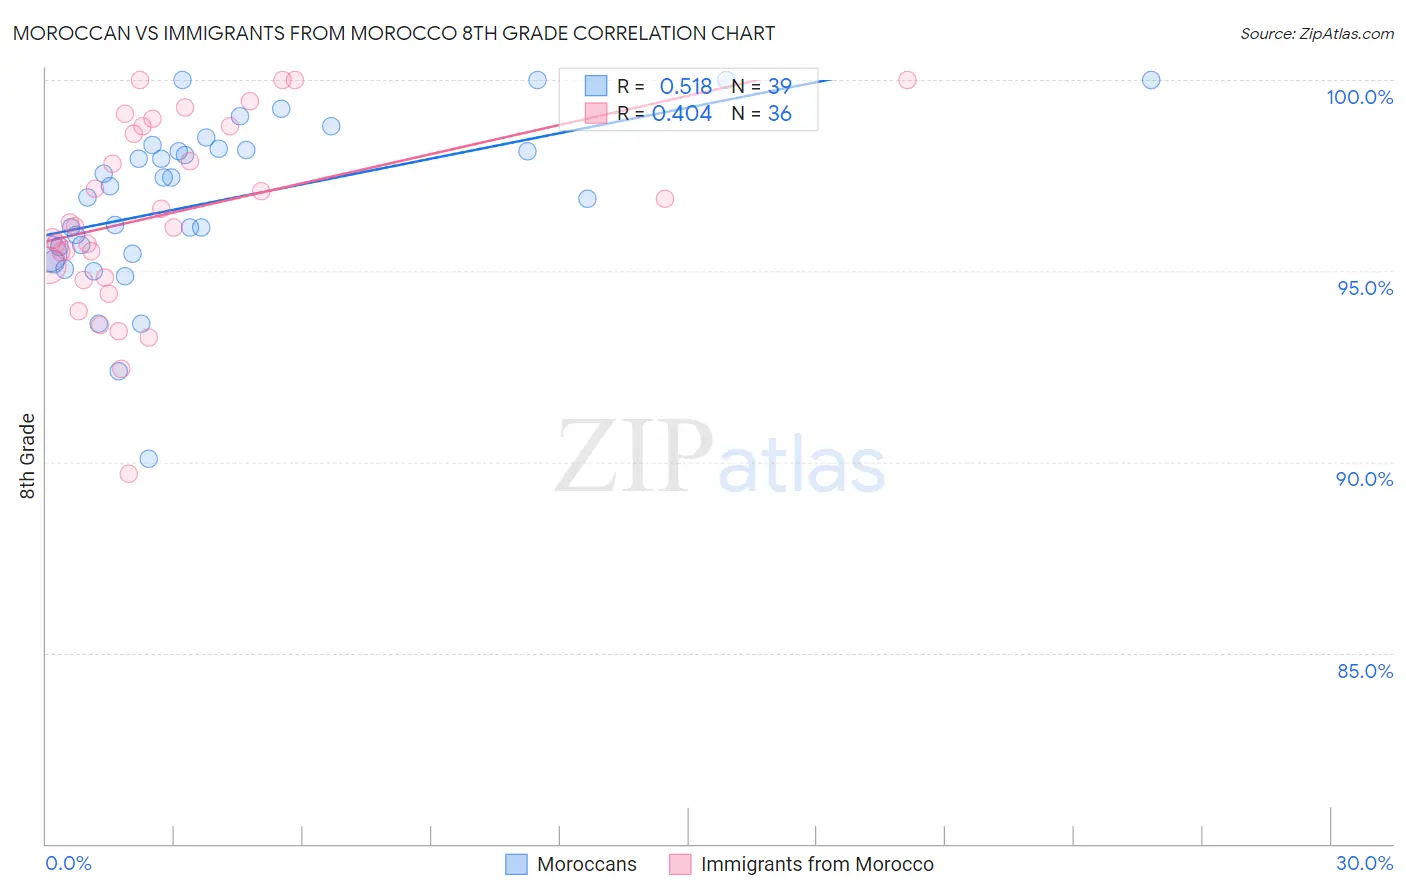
Moroccan vs Immigrants from Morocco 8th Grade Correlation Chart
The statistical analysis conducted on geographies consisting of 201,817,667 people shows a substantial positive correlation between the proportion of Moroccans and percentage of population with at least 8th grade education in the United States with a correlation coefficient (R) of 0.518 and weighted average of 95.5%. Similarly, the statistical analysis conducted on geographies consisting of 178,910,634 people shows a moderate positive correlation between the proportion of Immigrants from Morocco and percentage of population with at least 8th grade education in the United States with a correlation coefficient (R) of 0.404 and weighted average of 95.4%, a difference of 0.060%.
8th Grade Correlation Summary
| Measurement | Moroccan | Immigrants from Morocco |
| Minimum | 90.1% | 89.7% |
| Maximum | 100.0% | 100.0% |
| Range | 9.9% | 10.3% |
| Mean | 96.8% | 96.5% |
| Median | 97.2% | 96.2% |
| Interquartile 25% (IQ1) | 95.5% | 95.0% |
| Interquartile 75% (IQ3) | 98.2% | 98.8% |
| Interquartile Range (IQR) | 2.7% | 3.8% |
| Standard Deviation (Sample) | 2.2% | 2.5% |
| Standard Deviation (Population) | 2.2% | 2.4% |
Demographics Similar to Moroccans and Immigrants from Morocco by 8th Grade
In terms of 8th grade, the demographic groups most similar to Moroccans are Hawaiian (95.5%, a difference of 0.010%), Immigrants from Bahamas (95.5%, a difference of 0.010%), Comanche (95.5%, a difference of 0.010%), Apache (95.5%, a difference of 0.020%), and Immigrants from Argentina (95.5%, a difference of 0.030%). Similarly, the demographic groups most similar to Immigrants from Morocco are Immigrants from Lebanon (95.4%, a difference of 0.020%), African (95.4%, a difference of 0.020%), Portuguese (95.5%, a difference of 0.030%), Immigrants from Sudan (95.5%, a difference of 0.040%), and Comanche (95.5%, a difference of 0.050%).
| Demographics | Rating | Rank | 8th Grade |
| Sierra Leoneans | 24.3 /100 | #197 | Fair 95.6% |
| Paraguayans | 22.6 /100 | #198 | Fair 95.5% |
| Immigrants | Northern Africa | 22.5 /100 | #199 | Fair 95.5% |
| Argentineans | 22.2 /100 | #200 | Fair 95.5% |
| Immigrants | Argentina | 20.6 /100 | #201 | Fair 95.5% |
| Apache | 19.4 /100 | #202 | Poor 95.5% |
| Moroccans | 17.4 /100 | #203 | Poor 95.5% |
| Hawaiians | 16.7 /100 | #204 | Poor 95.5% |
| Immigrants | Bahamas | 16.7 /100 | #205 | Poor 95.5% |
| Comanche | 16.3 /100 | #206 | Poor 95.5% |
| Immigrants | Sudan | 15.1 /100 | #207 | Poor 95.5% |
| Portuguese | 14.3 /100 | #208 | Poor 95.5% |
| Immigrants | Lebanon | 13.7 /100 | #209 | Poor 95.4% |
| Africans | 13.6 /100 | #210 | Poor 95.4% |
| Immigrants | Morocco | 12.4 /100 | #211 | Poor 95.4% |
| Immigrants | Pakistan | 9.7 /100 | #212 | Tragic 95.4% |
| Laotians | 9.0 /100 | #213 | Tragic 95.4% |
| Immigrants | Chile | 9.0 /100 | #214 | Tragic 95.4% |
| Immigrants | Liberia | 8.9 /100 | #215 | Tragic 95.4% |
| Samoans | 8.4 /100 | #216 | Tragic 95.4% |
| Immigrants | Eastern Asia | 8.3 /100 | #217 | Tragic 95.4% |