Mexican American Indian vs European Single Male Poverty
COMPARE
Mexican American Indian
European
Single Male Poverty
Single Male Poverty Comparison
Mexican American Indians
Europeans
13.1%
SINGLE MALE POVERTY
17.5/ 100
METRIC RATING
209th/ 347
METRIC RANK
13.3%
SINGLE MALE POVERTY
6.2/ 100
METRIC RATING
229th/ 347
METRIC RANK
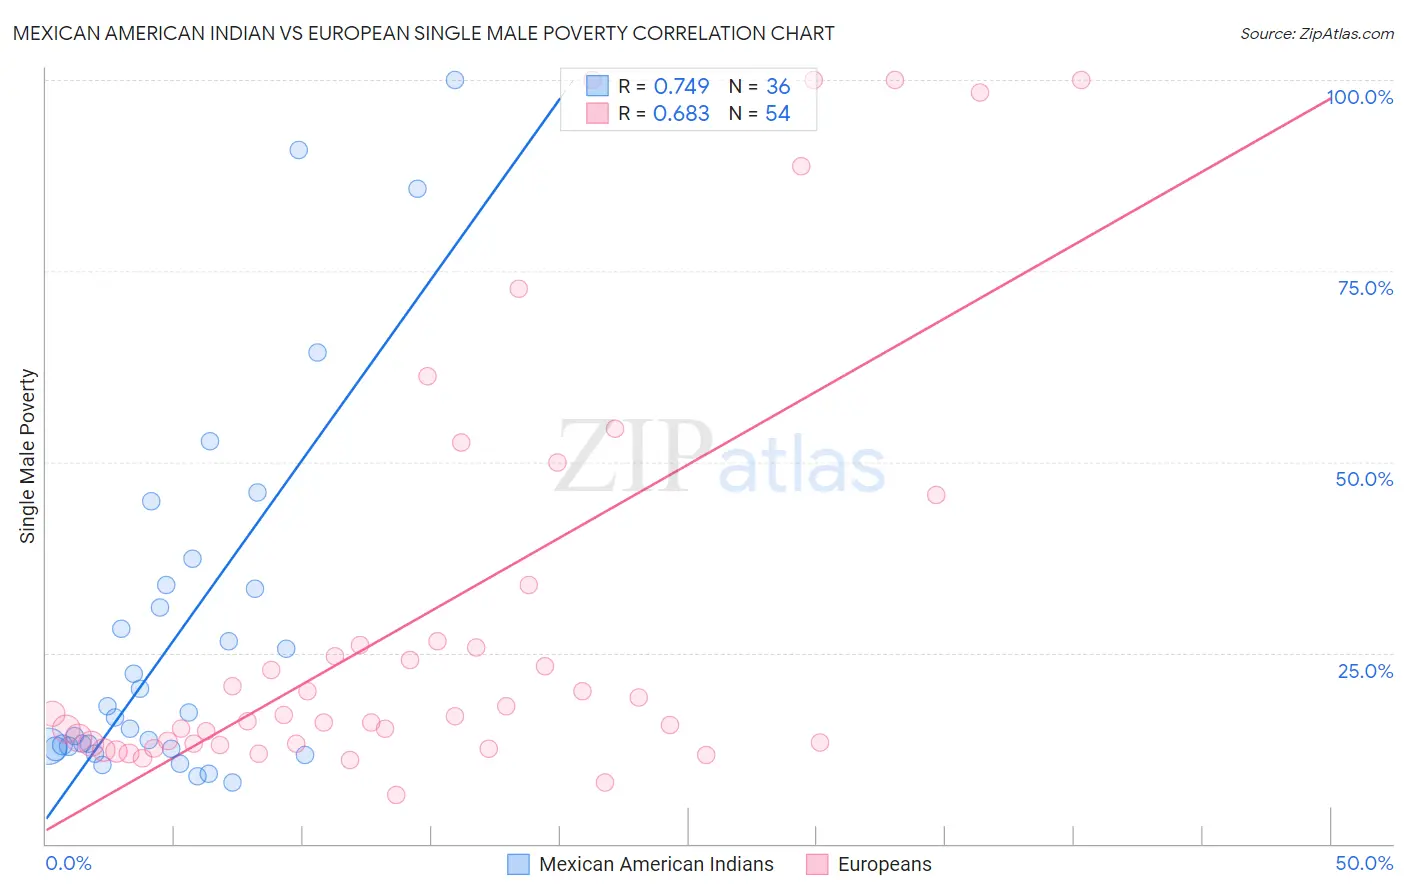
Mexican American Indian vs European Single Male Poverty Correlation Chart
The statistical analysis conducted on geographies consisting of 294,400,440 people shows a strong positive correlation between the proportion of Mexican American Indians and poverty level among single males in the United States with a correlation coefficient (R) of 0.749 and weighted average of 13.1%. Similarly, the statistical analysis conducted on geographies consisting of 466,343,596 people shows a significant positive correlation between the proportion of Europeans and poverty level among single males in the United States with a correlation coefficient (R) of 0.683 and weighted average of 13.3%, a difference of 1.5%.
Single Male Poverty Correlation Summary
| Measurement | Mexican American Indian | European |
| Minimum | 8.1% | 6.4% |
| Maximum | 100.0% | 100.0% |
| Range | 91.9% | 93.6% |
| Mean | 27.7% | 29.9% |
| Median | 16.8% | 16.8% |
| Interquartile 25% (IQ1) | 12.6% | 13.1% |
| Interquartile 75% (IQ3) | 33.6% | 26.5% |
| Interquartile Range (IQR) | 21.0% | 13.3% |
| Standard Deviation (Sample) | 23.9% | 27.9% |
| Standard Deviation (Population) | 23.6% | 27.6% |
Demographics Similar to Mexican American Indians and Europeans by Single Male Poverty
In terms of single male poverty, the demographic groups most similar to Mexican American Indians are Immigrants from Haiti (13.1%, a difference of 0.060%), Swedish (13.1%, a difference of 0.060%), Senegalese (13.1%, a difference of 0.10%), Italian (13.1%, a difference of 0.15%), and Zimbabwean (13.1%, a difference of 0.24%). Similarly, the demographic groups most similar to Europeans are Lebanese (13.2%, a difference of 0.090%), Haitian (13.2%, a difference of 0.17%), Jamaican (13.2%, a difference of 0.31%), Immigrants from Denmark (13.2%, a difference of 0.47%), and Somali (13.2%, a difference of 0.52%).
| Demographics | Rating | Rank | Single Male Poverty |
| Mexican American Indians | 17.5 /100 | #209 | Poor 13.1% |
| Immigrants | Haiti | 16.8 /100 | #210 | Poor 13.1% |
| Swedes | 16.8 /100 | #211 | Poor 13.1% |
| Senegalese | 16.4 /100 | #212 | Poor 13.1% |
| Italians | 15.9 /100 | #213 | Poor 13.1% |
| Zimbabweans | 14.9 /100 | #214 | Poor 13.1% |
| Japanese | 14.8 /100 | #215 | Poor 13.1% |
| Austrians | 13.9 /100 | #216 | Poor 13.1% |
| Bermudans | 13.0 /100 | #217 | Poor 13.1% |
| Scandinavians | 12.9 /100 | #218 | Poor 13.1% |
| Immigrants | Burma/Myanmar | 12.6 /100 | #219 | Poor 13.1% |
| Central Americans | 10.9 /100 | #220 | Poor 13.2% |
| New Zealanders | 10.7 /100 | #221 | Poor 13.2% |
| Immigrants | Western Europe | 10.0 /100 | #222 | Poor 13.2% |
| Immigrants | Azores | 9.3 /100 | #223 | Tragic 13.2% |
| Somalis | 9.1 /100 | #224 | Tragic 13.2% |
| Immigrants | Denmark | 8.7 /100 | #225 | Tragic 13.2% |
| Jamaicans | 7.7 /100 | #226 | Tragic 13.2% |
| Haitians | 7.0 /100 | #227 | Tragic 13.2% |
| Lebanese | 6.6 /100 | #228 | Tragic 13.2% |
| Europeans | 6.2 /100 | #229 | Tragic 13.3% |