Menominee vs Immigrants from Moldova Single Father Poverty
COMPARE
Menominee
Immigrants from Moldova
Single Father Poverty
Single Father Poverty Comparison
Menominee
Immigrants from Moldova
16.8%
SINGLE FATHER POVERTY
6.4/ 100
METRIC RATING
225th/ 347
METRIC RANK
15.2%
SINGLE FATHER POVERTY
99.8/ 100
METRIC RATING
66th/ 347
METRIC RANK
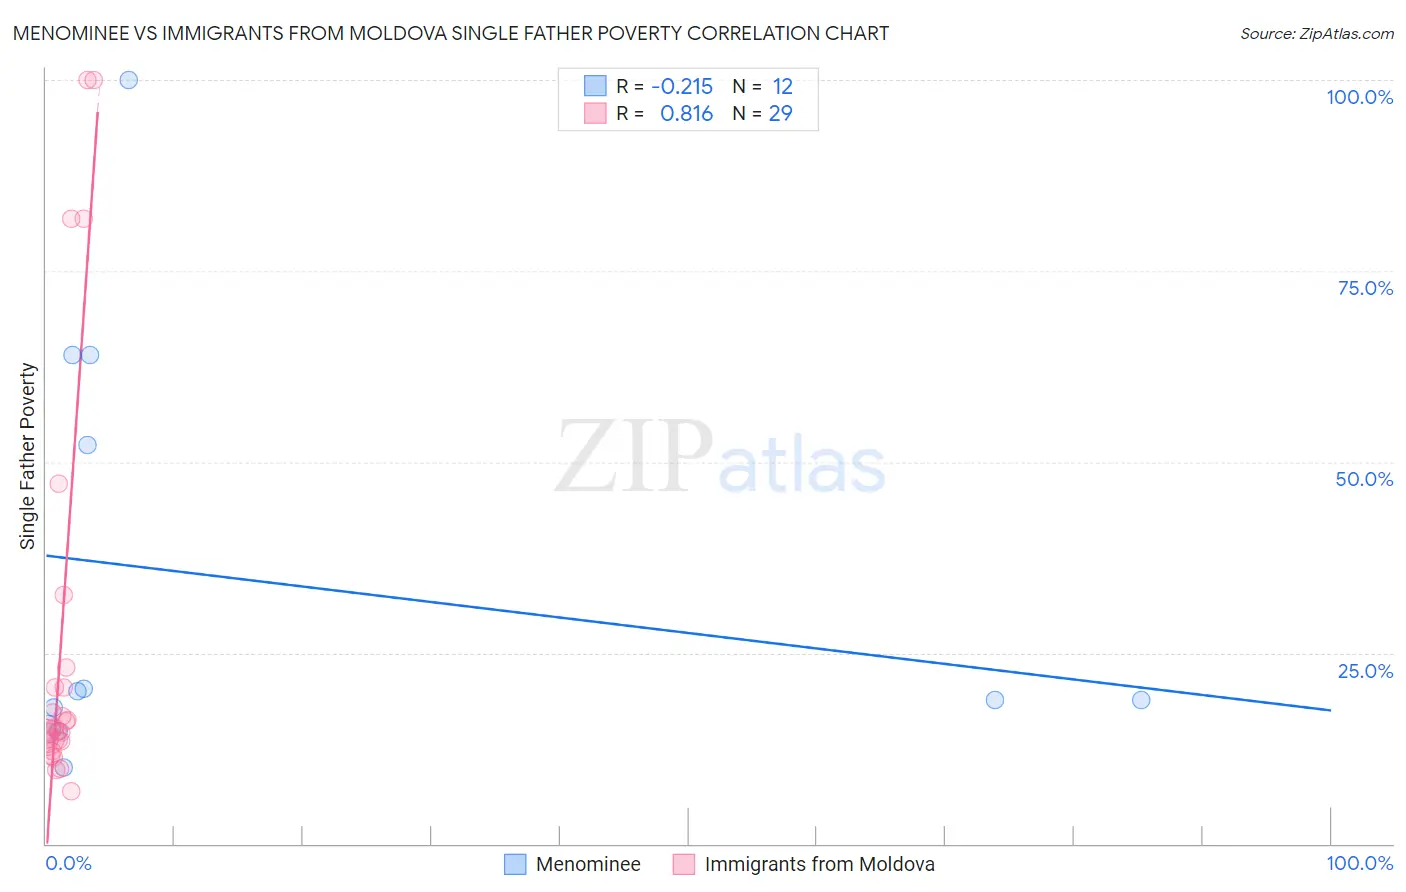
Menominee vs Immigrants from Moldova Single Father Poverty Correlation Chart
The statistical analysis conducted on geographies consisting of 42,801,282 people shows a weak negative correlation between the proportion of Menominee and poverty level among single fathers in the United States with a correlation coefficient (R) of -0.215 and weighted average of 16.8%. Similarly, the statistical analysis conducted on geographies consisting of 107,585,694 people shows a very strong positive correlation between the proportion of Immigrants from Moldova and poverty level among single fathers in the United States with a correlation coefficient (R) of 0.816 and weighted average of 15.2%, a difference of 10.3%.
Single Father Poverty Correlation Summary
| Measurement | Menominee | Immigrants from Moldova |
| Minimum | 9.9% | 6.9% |
| Maximum | 100.0% | 100.0% |
| Range | 90.1% | 93.1% |
| Mean | 34.6% | 26.8% |
| Median | 19.4% | 14.7% |
| Interquartile 25% (IQ1) | 16.4% | 13.3% |
| Interquartile 75% (IQ3) | 58.1% | 21.8% |
| Interquartile Range (IQR) | 41.7% | 8.4% |
| Standard Deviation (Sample) | 28.5% | 27.4% |
| Standard Deviation (Population) | 27.2% | 26.9% |
Similar Demographics by Single Father Poverty
Demographics Similar to Menominee by Single Father Poverty
In terms of single father poverty, the demographic groups most similar to Menominee are Immigrants from Norway (16.8%, a difference of 0.020%), Hispanic or Latino (16.8%, a difference of 0.050%), Immigrants from Austria (16.8%, a difference of 0.10%), British (16.8%, a difference of 0.15%), and Belgian (16.8%, a difference of 0.21%).
| Demographics | Rating | Rank | Single Father Poverty |
| Immigrants | Uganda | 8.6 /100 | #218 | Tragic 16.7% |
| Immigrants | Ghana | 8.1 /100 | #219 | Tragic 16.7% |
| Immigrants | Denmark | 8.1 /100 | #220 | Tragic 16.7% |
| Immigrants | Greece | 8.1 /100 | #221 | Tragic 16.7% |
| Immigrants | Spain | 8.0 /100 | #222 | Tragic 16.7% |
| Immigrants | Austria | 7.0 /100 | #223 | Tragic 16.8% |
| Immigrants | Norway | 6.5 /100 | #224 | Tragic 16.8% |
| Menominee | 6.4 /100 | #225 | Tragic 16.8% |
| Hispanics or Latinos | 6.1 /100 | #226 | Tragic 16.8% |
| British | 5.6 /100 | #227 | Tragic 16.8% |
| Belgians | 5.3 /100 | #228 | Tragic 16.8% |
| Israelis | 4.6 /100 | #229 | Tragic 16.8% |
| Immigrants | Trinidad and Tobago | 4.5 /100 | #230 | Tragic 16.8% |
| Spanish Americans | 3.7 /100 | #231 | Tragic 16.9% |
| Immigrants | Grenada | 3.7 /100 | #232 | Tragic 16.9% |
Demographics Similar to Immigrants from Moldova by Single Father Poverty
In terms of single father poverty, the demographic groups most similar to Immigrants from Moldova are Immigrants from Malaysia (15.2%, a difference of 0.020%), Paraguayan (15.2%, a difference of 0.090%), Bangladeshi (15.2%, a difference of 0.11%), Immigrants from Cameroon (15.2%, a difference of 0.18%), and Immigrants from Sweden (15.2%, a difference of 0.19%).
| Demographics | Rating | Rank | Single Father Poverty |
| Guamanians/Chamorros | 99.9 /100 | #59 | Exceptional 15.1% |
| Puget Sound Salish | 99.8 /100 | #60 | Exceptional 15.2% |
| Immigrants | Bosnia and Herzegovina | 99.8 /100 | #61 | Exceptional 15.2% |
| Immigrants | Armenia | 99.8 /100 | #62 | Exceptional 15.2% |
| Immigrants | Sweden | 99.8 /100 | #63 | Exceptional 15.2% |
| Bangladeshis | 99.8 /100 | #64 | Exceptional 15.2% |
| Immigrants | Malaysia | 99.8 /100 | #65 | Exceptional 15.2% |
| Immigrants | Moldova | 99.8 /100 | #66 | Exceptional 15.2% |
| Paraguayans | 99.7 /100 | #67 | Exceptional 15.2% |
| Immigrants | Cameroon | 99.7 /100 | #68 | Exceptional 15.2% |
| Japanese | 99.7 /100 | #69 | Exceptional 15.2% |
| Mongolians | 99.7 /100 | #70 | Exceptional 15.3% |
| Immigrants | Brazil | 99.6 /100 | #71 | Exceptional 15.3% |
| Immigrants | Lithuania | 99.6 /100 | #72 | Exceptional 15.3% |
| Kenyans | 99.6 /100 | #73 | Exceptional 15.3% |